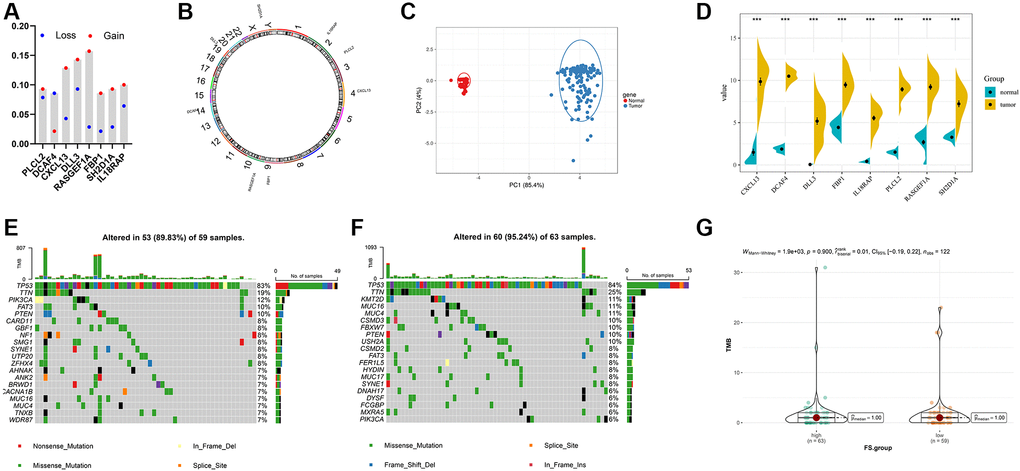
Figure 7.Landscape of genetic and expression variation of FS in TNBC. (A) The CNV variation frequency of FS gene signatures in TNBC-TNBC cohort. (B) The location of CNV alteration of FS gene signatures on 23 chromosomes in TCGA-TNBC cohort. (C) Principal component analysis for the expression profiles of 8 FS gene signatures to distinguish tumors from normal samples in TCGA-TNBC cohort. (D) The expression of 8 FS gene signatures between normal and tumor tissues. (E, F) The waterfall plot of tumor somatic mutation of the low- (E) and high-FS subgroups (F) in TCGA-TNBC cohort. (G) The TMB status between the low- and high-FS subgroups in TCGA-TNBC cohort.