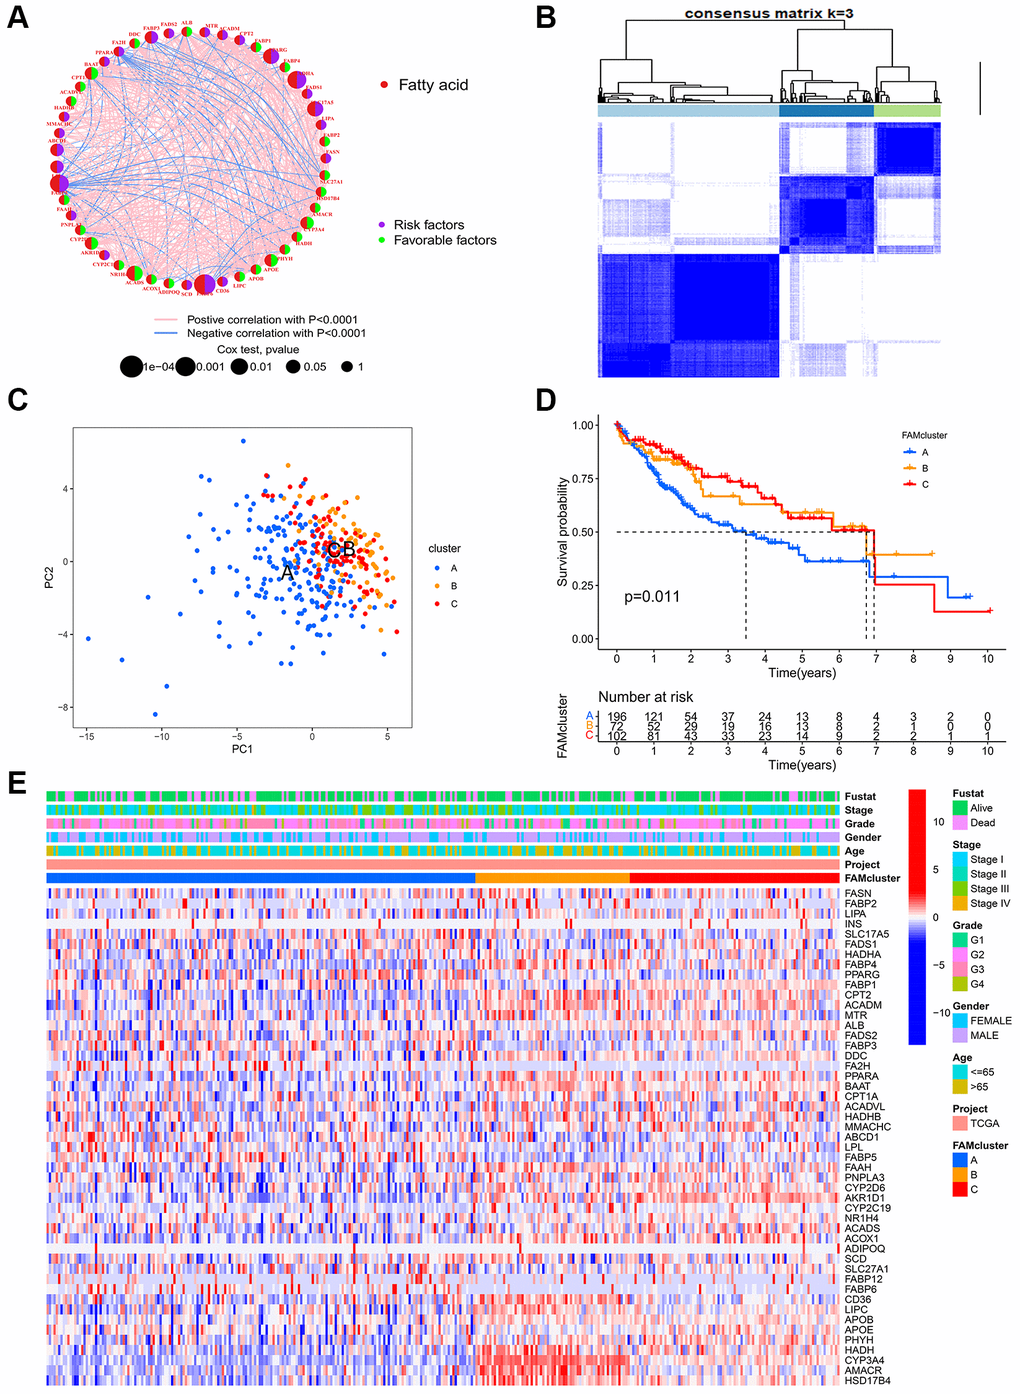
Figure 2.FAM clusters and relevant clinical features. (A) The interaction of expression on 49 FAMs in HCC. The line connecting the FAMs represents their interactions, with the line thickness indicating the strength of the association between FAMs. Red dots, fatty acid metabolism-related genes; Purple dots, risk factors for HCC; Green dots, favorable factors for HCC; Pink edges, positive correlation with P < 0.0001; Blue edges, negative correlation with P < 0.0001. (B) Consensus matrices of 49 FAMs in HCC for k = 3. (C) PCA analysis showing a remarkable difference in transcriptomes between the three FAM clusters in TCGA cohort. (D) K-M curve for the three FAM clusters. (E) The heatmap of clinical characteristics and expression levels of FAMs in different clusters. Abbreviations: FAM: fatty acid metabolism; FAMs: fatty acid metabolism-related genes; HCC: hepatocellular carcinoma; PCA: principal component analysis.