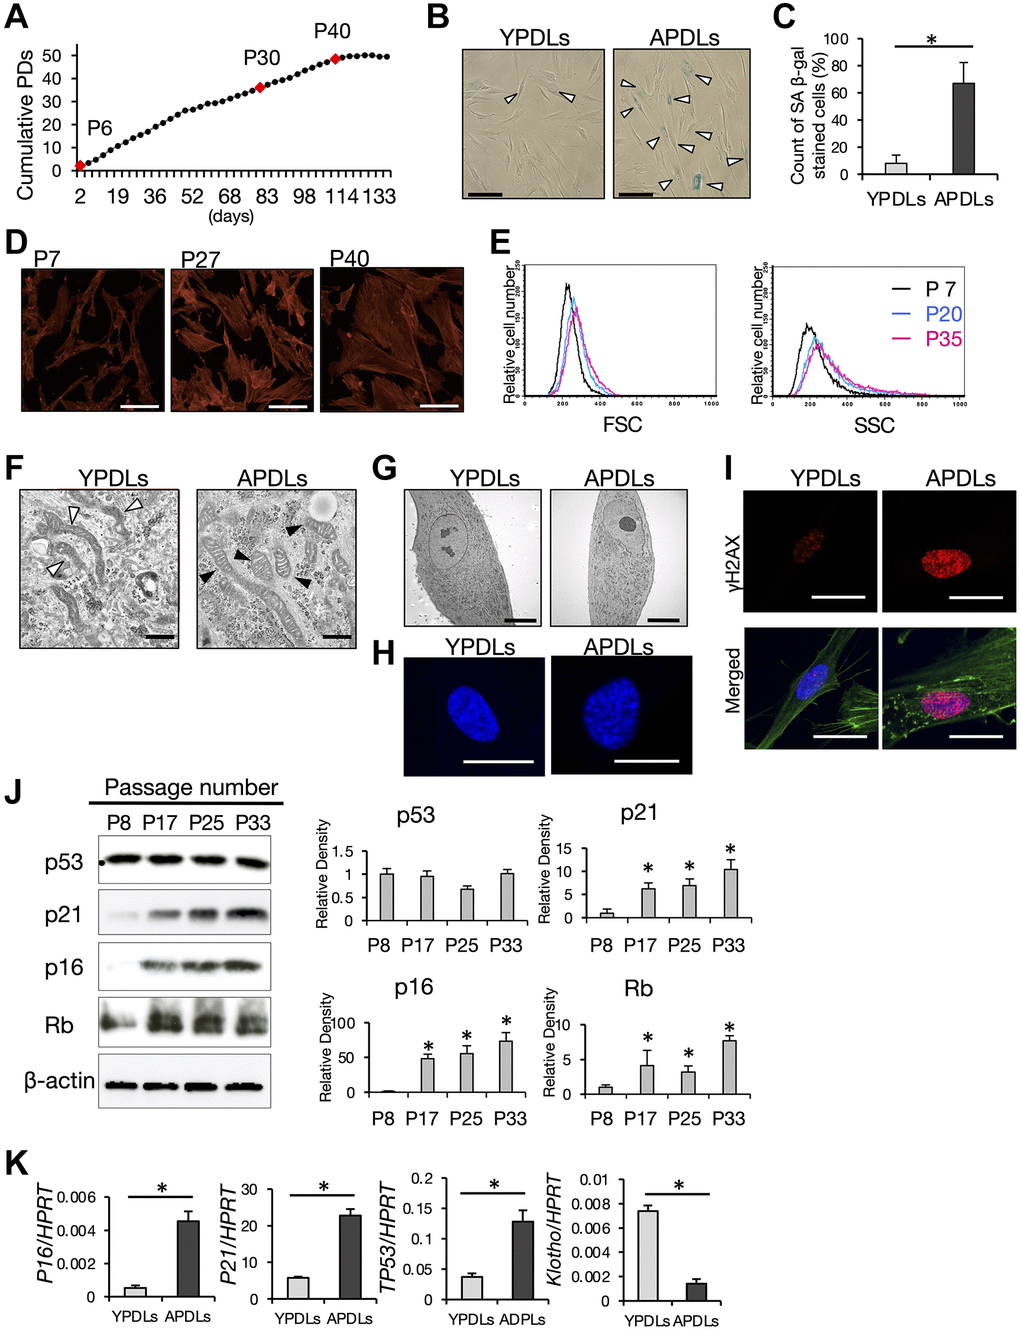
Figure 2.Establishment of senescent HPDL cells in vitro. (A) Long-term growth curve of primary human periodontal ligament (HPDL) cells. Cumulative population doublings (PDs) in each cell passage were estimated in long-term cultures. Final numbers of HPDL cells at the indicated passage are shown. P6, P30, and P40 represent early, premature, and late senescence of HPDL cells in vitro. Representative data from three experiments are shown. (B) SA β-gal staining of YPDLs and APDLs. Scale bar = 50 μm. White bar: YPDLs; black bar: APDLs (C) Quantification of SA β-gal-positive YPDLs and APDLs (*p < 0.01). Representative data from three experiments are shown. (D) Phalloidin staining of P7, P27, and P40 HPDL cells (×400). Scale bar = 200 μm. Representative data from three experiments are shown. (E) Quantification of the size of HPDL cells at P7, P20, and P35 HPDL cells. FSC and SSC of flow cytometric analysis are shown. Representative data from three experiments are shown. (F) Representative transmission electron microscopy images of mitochondria in YPDLs and APDLs. White arrows indicate lamellar shaped mitochondria. Black arrows indicate disorganized mitochondria (×31800). Scale bar = 500 nm (G) Transmission electron microscopy of induction of aggregated chromosomal DNA in YPDLs and APDLs. (×1760). Scale bar = 10 μm. (H) Analysis of SAHF in YPDLs and APDLs. DAPI staining of YPDLs and APDLs (×1000). Scale bar = 25 μm. (I) Confocal image of γH2AX staining in YPDLs and APDLs. Red: γH2AX; Green: Actin fiber; Blue: DAPI staining (×400). Scale bar = 25 μm. (J) Protein expression of cell cycle arrest-related factors p53, p21, p16, and Rb in P8, P17, P25, and P33 HPDL cells. β-actin was used as a loading control. Representative band images are shown, and the relative protein levels were quantified (*p < 0.01). (K) Increased expression of senescence-related biomarkers in YPDLs and APDLs. Relative mRNA expression of p16, p21, p53, and klotho to HPRT in HPDL cells quantified by qRT-PCR. Gray bar: YPDLs; Black bar: APDLs. Data are presented as the mean ± SE (*p < 0.01). Representative data from three experiments are shown.