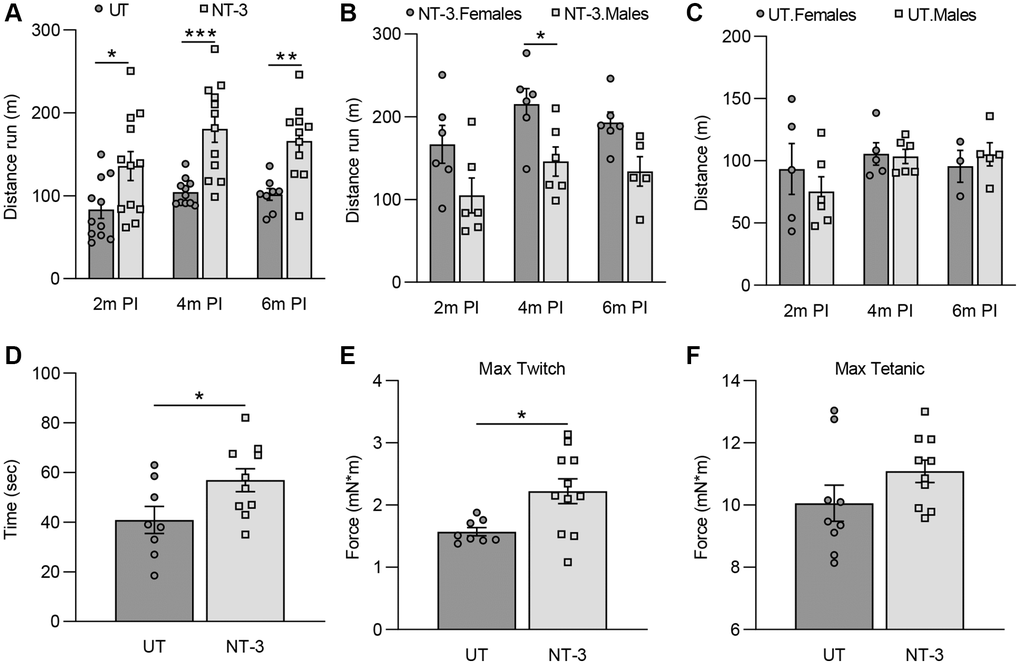
Figure 1.Functional and in vivo muscle physiology improvements in 2-year-old C57BL/6 mice with AAV1.NT-3 gene transfer therapy. (A–C) Treadmill performance test performed at 2-, 4-, and 6-months post-injection (PI). (A) AAV1.NT-3 treated mice showed significant improvement at the time points tested (2 months PI, NT-3: 135.8 m, n = 12 vs. UT: 83.5 m, n = 11, p = 0.0184; 4 months PI, NT-3: 180.6 m, n = 12 vs. UT: 104.4 m, n = 11, p = 0.0003; 6 months PI, NT-3: 166.1 m, n = 11, vs. UT: 101.6 m, n = 8; p = 0.0077). (B) Treadmill performance of the female mice was better than the males in the treated cohort (2 months PI, F: 166.7 m, n = 6 vs. M: 104.9 m, n = 6; 4 months PI, F: 215.3 m, n = 6 vs. M: 145.9 m, n = 6, p = 0.0394; 6 months PI, F: 192.9 m, n = 6, vs. M: 133.9 m, n = 5) while no sex effect was observed in the (C) untreated cohort (2 months PI, F: 93.4 m, n = 5 vs. M: 75.3 m, n = 6; 4 months PI, F: 105.5 m, n = 5 vs. M: 103.5 m, n = 6; 6 months PI, F: 95.6 m, n = 3, vs. M: 105.2 m, n = 5). (D) AAV1.NT-3 treated mice showed significant improvement in the rotarod at end point (NT-3: 56.9 sec, n = 10 vs. UT: 40.9 sec, n = 8, p = 0.0374). In vivo muscle contractility assay showed a higher force output in (E) maximum twitch response in the treated cohort whereas (F) increase in the maximum tetanic measurement did not reach significance levels (Max twitch, NT-3: 2.22 mN*m, n = 11 vs. UT: 1.57 mN*m, n = 8, p = 0.0149; Max tetanic, NT-3: 11.09 mN*m, n = 10 vs. UT: 10.06 mN*m, n = 9). Data is represented as mean ± SEM; Two-way ANOVA, Sidak’s multiple comparisons test for (A–C) and student t-test for (D–F); *p < 0.05, **p < 0.01, ***p < 0.001, ****p < 0.0001.