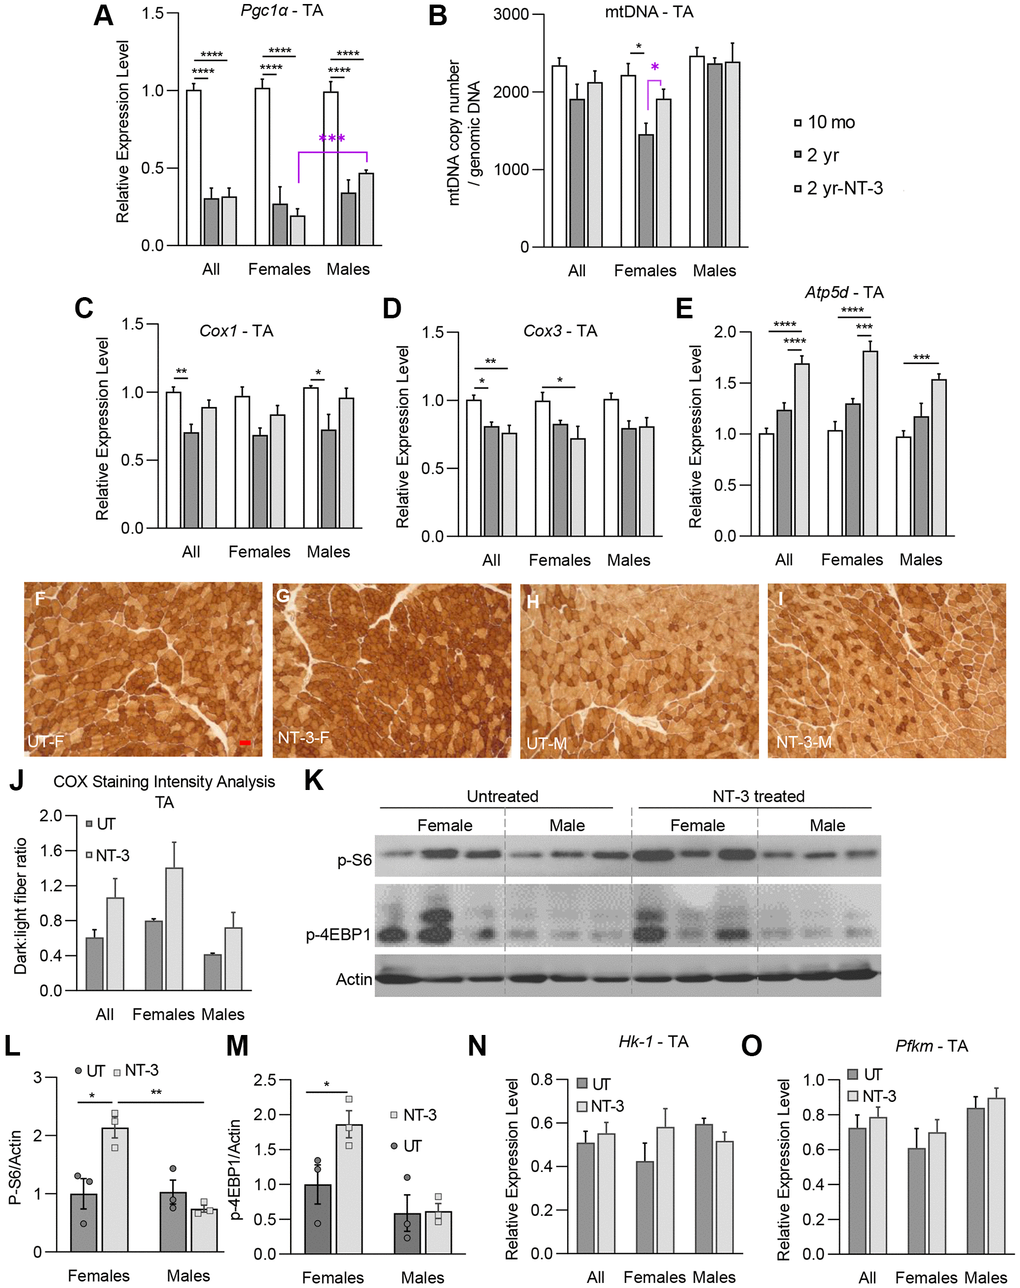
Figure 5.NT-3-treatment-induced changes on markers of mitochondrial biogenesis, oxidative phosphorylation and mTORC1 pathway in tibialis anterior muscle. Bar graphs represent (A) relative expression levels of Pgc1α, (B) mtDNA copy number/genomic DNA, relative expression levels of (C) Cox1, (D) Cox3, and (E) Atp5d genes of tibialis anterior muscle in treated and untreated C57BL/6 mice (n = 8, 10-month-old (mo) mice; n = 8, 2-year-old untreated mice (2 yr); n = 9, 2-year-old NT-3 treated (2 yr-NT-3) mice; with equal sex distribution). (F–I) Representative images of COX-stained sections of tibialis anterior muscle in the treated and untreated female and male mice. Scale bar: 25 μm, applies to all images (J) Bar graphs showing the intensity analysis on COX-stained sections (n = 6, untreated mice; n = 6, NT-3 treated mice; with equal sex distribution). (K) Western blots showing the expression level of p-S6, and p-4E-BP1 proteins. Protein levels of (L) p-S6, and (M) p-4E-BP1 normalized to Actin (n = 6 for both cohorts with equal sex distribution, blots were cropped for conciseness). Relative expression levels of (N) Hk-1 and (O) Pfkm enzymes (n = 8, 2-year-old untreated mice; n = 9, 2-year-old NT-3 treated mice). Student t-test for the analysis marked with purple asterisk. Two-way ANOVA, Tukey’s multiple comparisons test. Data is represented as mean ± SEM; *p < 0.05, **p < 0.01, ***p < 0.001, ****p < 0.0001.