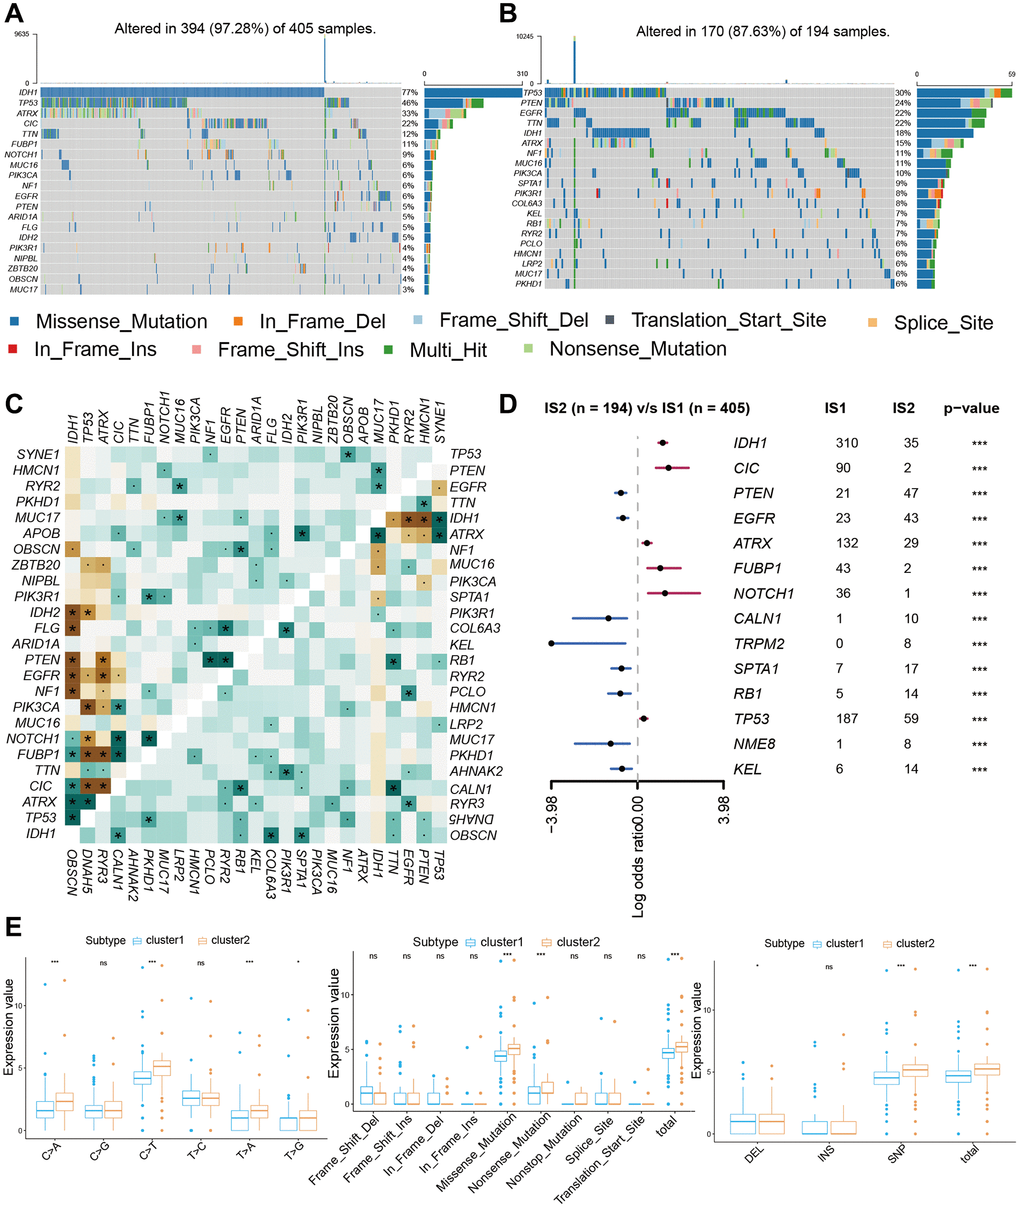
Figure 4.The mutation landscape of two cluster groups. (A, B) Waterfall diagram displays the mutation landscape of the top 20 most commonly mutation genes. (C) The heatmap analyzes the mutual co-occurrence and exclusion mutations of the top 25 commonly mutation genes. (D) The forest plot shows the top 10 most distinctively mutation genes between the two groups. (E) Boxplots displaying the comparisons of mutation frequencies of each mutation type classified by effects, SNV, DEL, INS, and SNP.