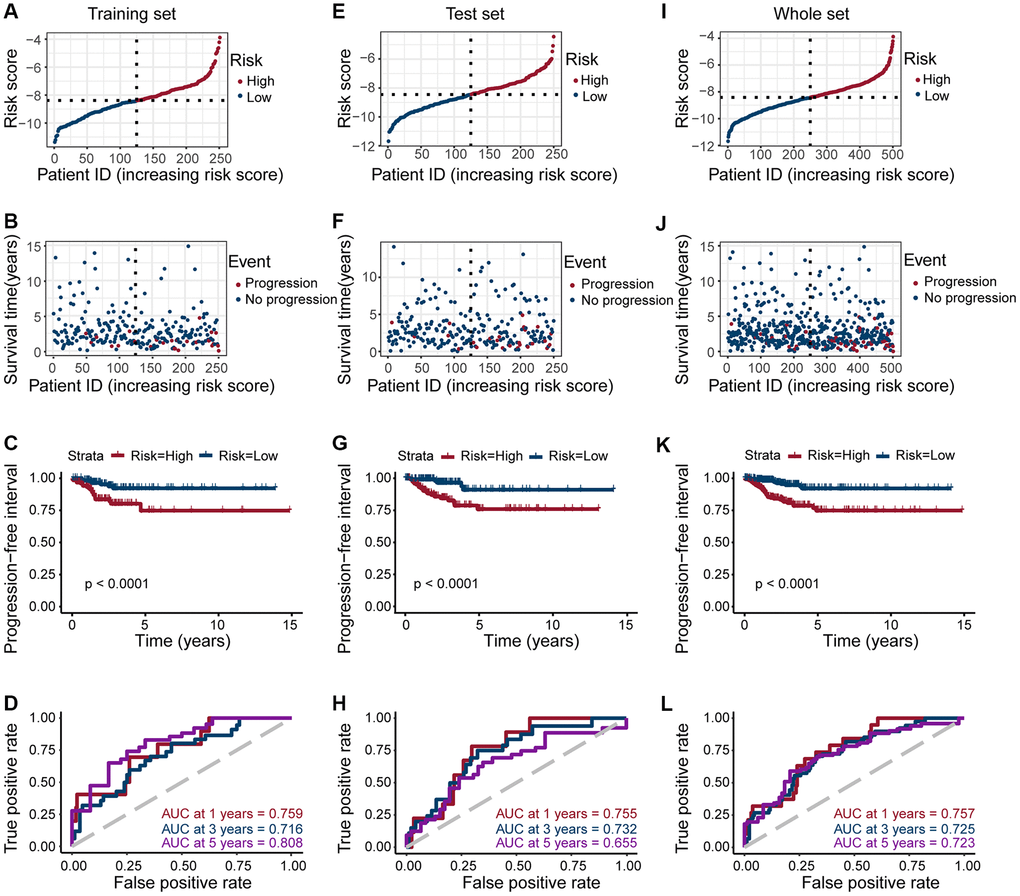
Figure 3.Risk grouping and PFI prediction for three data sets (training set, test set, and whole set). (A, E, I) Division of high-risk and low-risk groups in the training set, test set, and whole set (median value of risk scores for training set, test set, whole set = −8.388908, −8.454174, and −8.413054, respectively). (B, F, J) Survival time of patients in the progressive and non-progressive groups in the training set, test set and whole set. (C, G, K) Patients in the high-risk group had shorter PFI than in the low-risk group in the training set, test set and whole set (All p < 0.001). (D, H, L) The strong predictive potential of the prognostic features constructed from TOB1, TFF1, PLAAT3, NMU, KIF20A, TOP2A, TSPAN13, and CPE, similar results were observed in the test set and whole set.