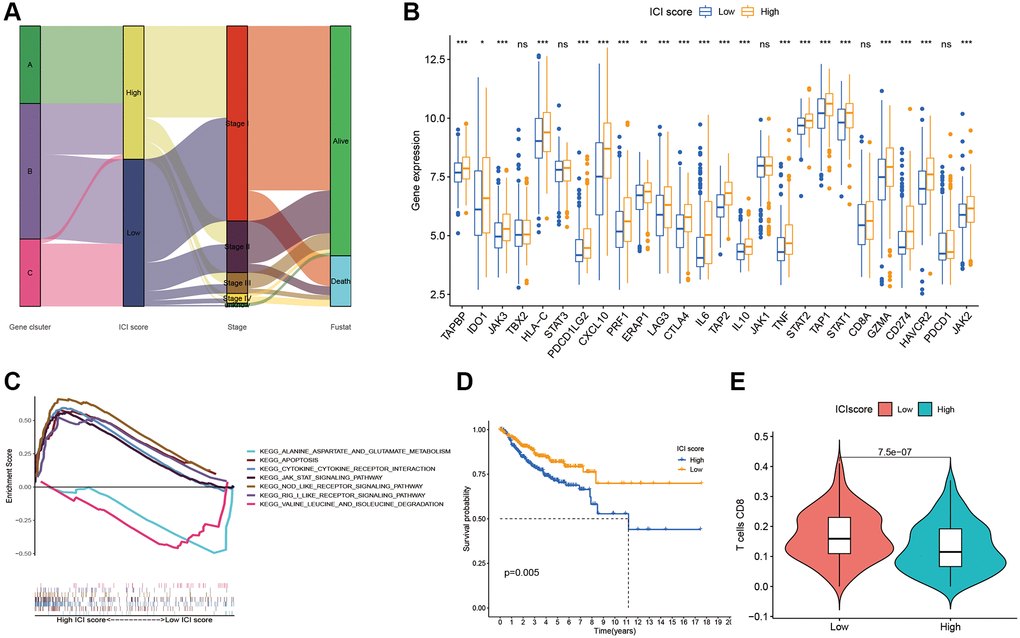
Figure 3.ICI Scores construction. (A) Sankey plot of ICI gene cluster, ICI scores, Stages, and OS. (B) Difference of immune-checkpoint, immune-activity-associated genes signature, and antigen presentation-related gene signature expression in the two ICI score subgroups. (C) Function pathways of ICI scores groups. (D) Kaplan-Meier plots of two ICI score groups. (E) The fraction of CD8+T cells in the two ICI score subgroups.