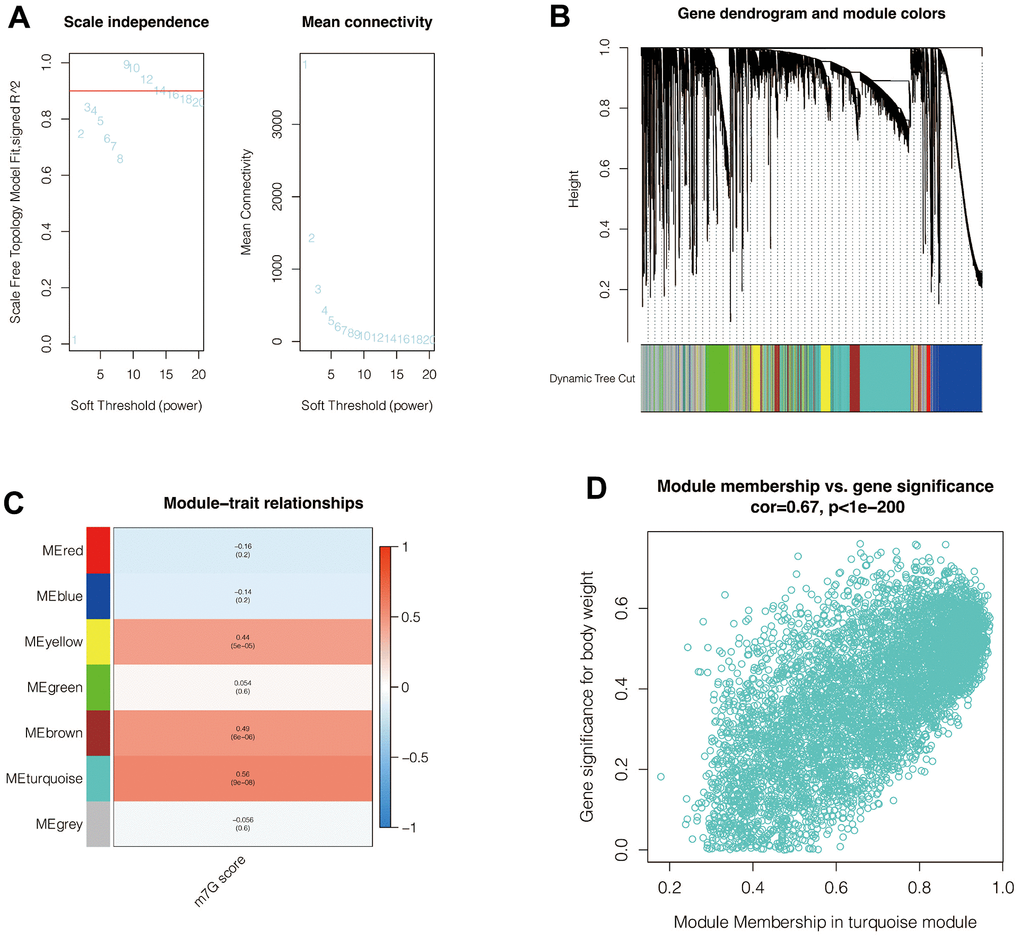
Figure 3.Weighted co-expression network analysis. (A) When setting a soft-zone threshold value reaches 9, R2 > 0.8, suggesting that the data fit a power-law distribution and were suitable for WGCNA analysis. Moreover, the mean connectivity fluctuates little as the soft domain value increases. (B, C) Clustering of modules. The turquoise module had the highest correlation with the M7G score. (D) The correlation coefficient between module membership correlation and gene significance for body weight was 0.67, with p <0.001.