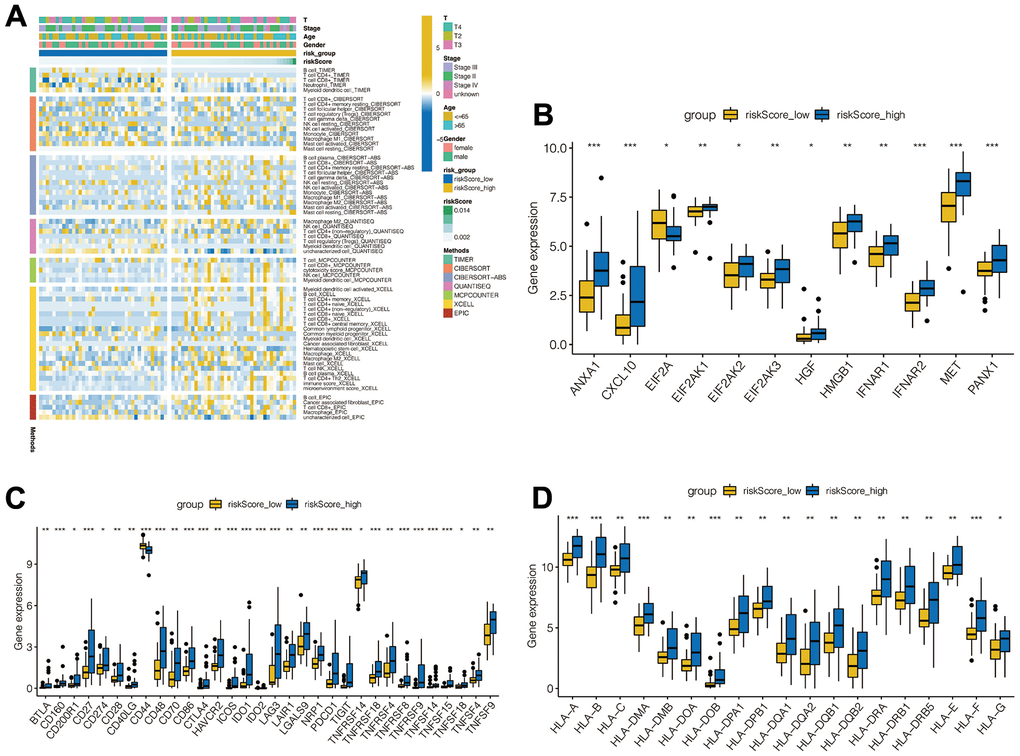
Figure 5.Analysis of immune microenvironment. (A) Immune landscapes between high-risk and low-risk groups. (B) Expression levels of immune checkpoint related genes between high-risk and low-risk groups. (C) Tumor necrosis factor-related gene expression levels between high - and low-risk groups. (D) Expression levels of leukocyte antigen related genes between high - and low-risk groups.