Submit an Article
Navigate
Home
Editorial Board
Editorial Policies
Current Volume
Archive
Scientific Integrity
Publication Ethics Statements
Interviews with Outstanding Authors
Newsroom
Sponsored Conferences
Podcast
Contact
Special Collections
Submit an Article
Online ISSN: 1945-4589
Research Paper
|
Volume 15, Issue 6
|
pp. 2082–2096
Single cell sequencing analysis constructed the N7-methylguanosine (m7G)-related prognostic signature in uveal melanoma
Back to article
Figure 7
(7 of 8)
−
100%
+
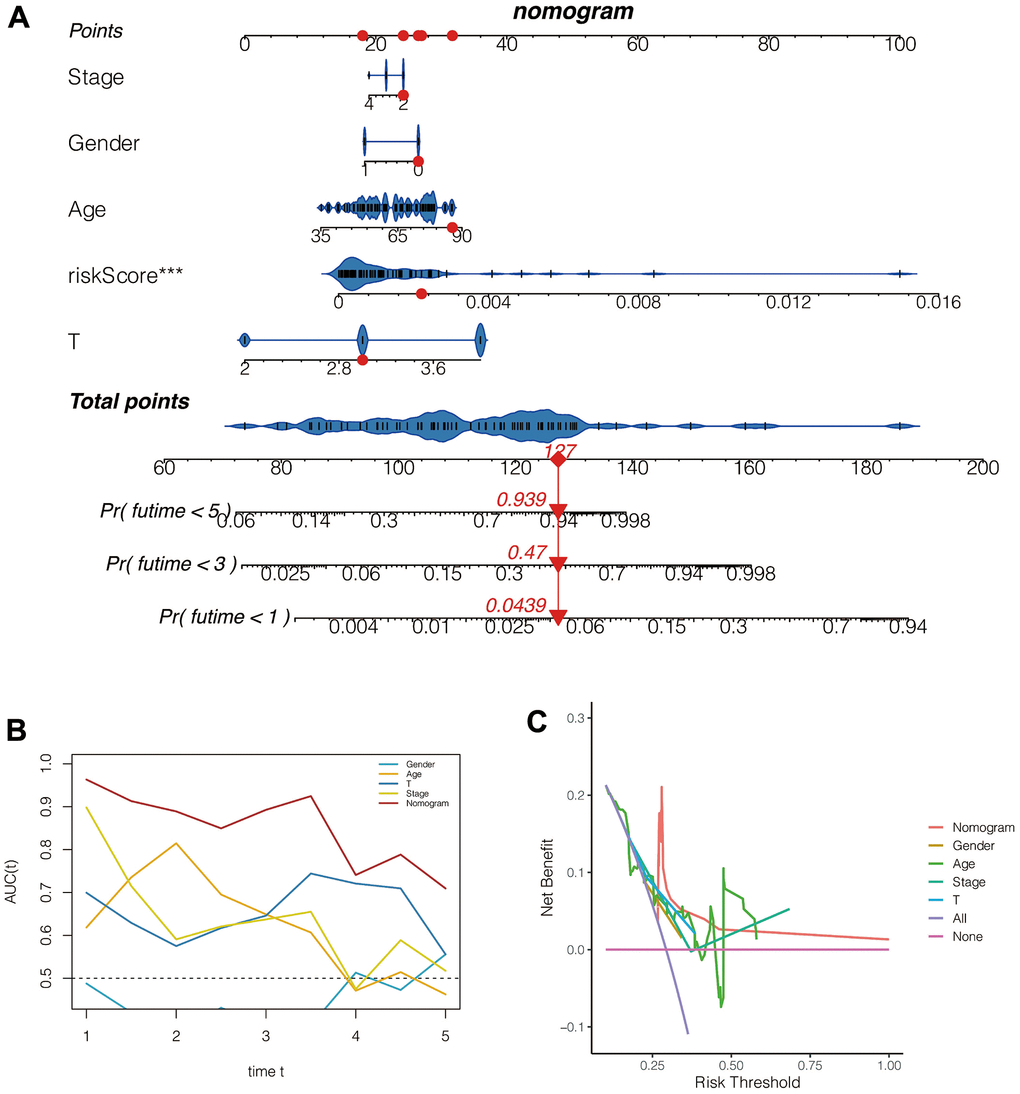
Figure 7.
Construction and evaluation of the nomogram.
(
A
) The nomogram. (
B
) The ROC curve. (
C
) The decision curve.
Figure 7 — Single cell sequencing analysis constructed the N7-methylguanosine (m7G)-related prognostic signature in uveal melanoma | Aging