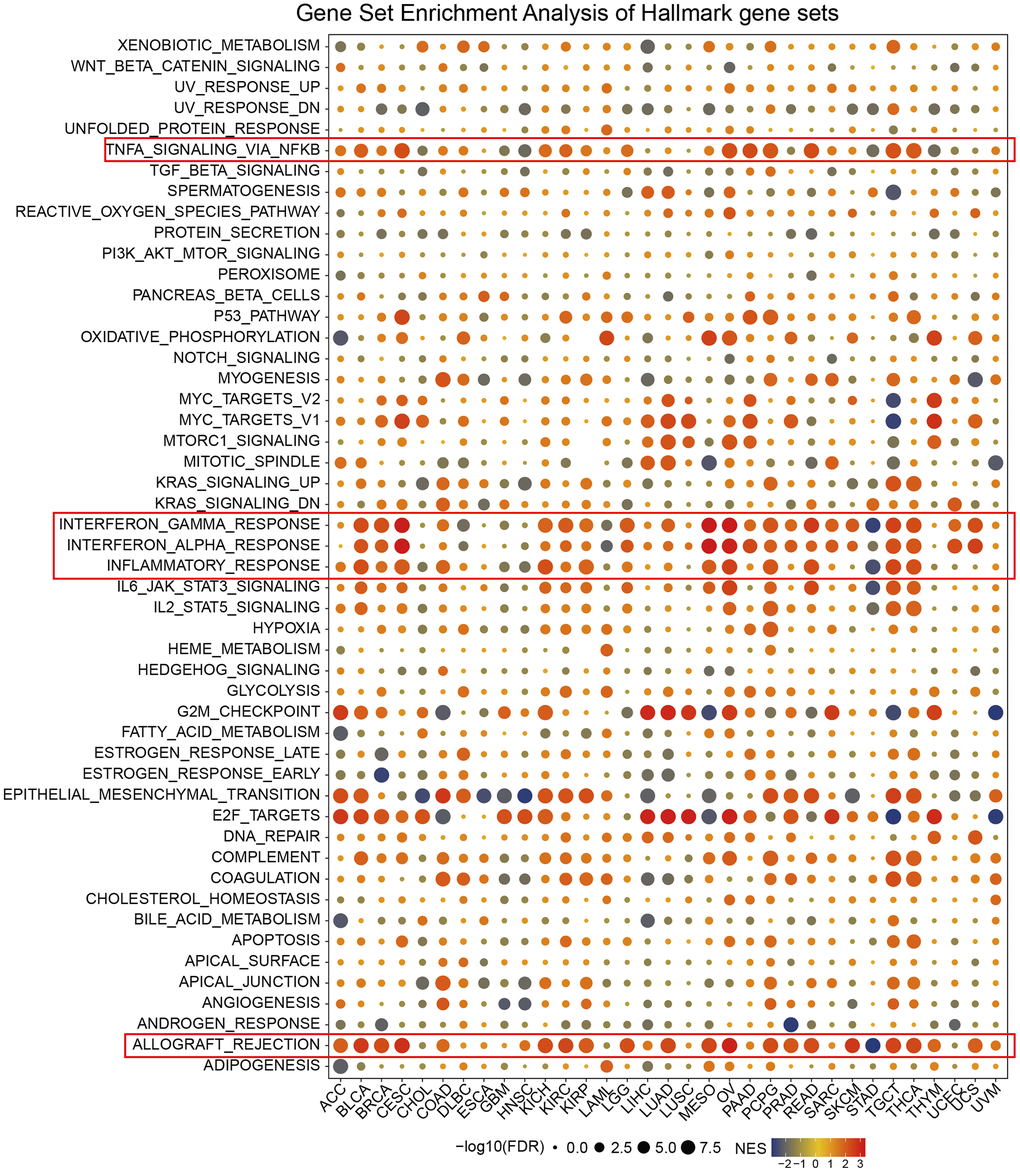
Figure 3.Enrichment analysis of CDKN2A marker gene set in pan-cancer. The circle size represents the FDR value of the enrichment term about each cancer. The color signifies the normalized enrichment score (NES).
Figure 3 — The cell senescence regulator p16 is a promising cancer prognostic and immune check-point inhibitor (ICI) therapy biomarker | Aging