Submit an Article
Navigate
Home
Editorial Board
Editorial Policies
Current Volume
Archive
Scientific Integrity
Publication Ethics Statements
Interviews with Outstanding Authors
Newsroom
Sponsored Conferences
Podcast
Contact
Special Collections
Submit an Article
Online ISSN: 1945-4589
Research Paper
|
Volume 15, Issue 6
|
pp. 1833–1839
Potential reversal of biological age in women following an 8-week methylation-supportive diet and lifestyle program: a case series
Back to article
Figure 1
−
100%
+
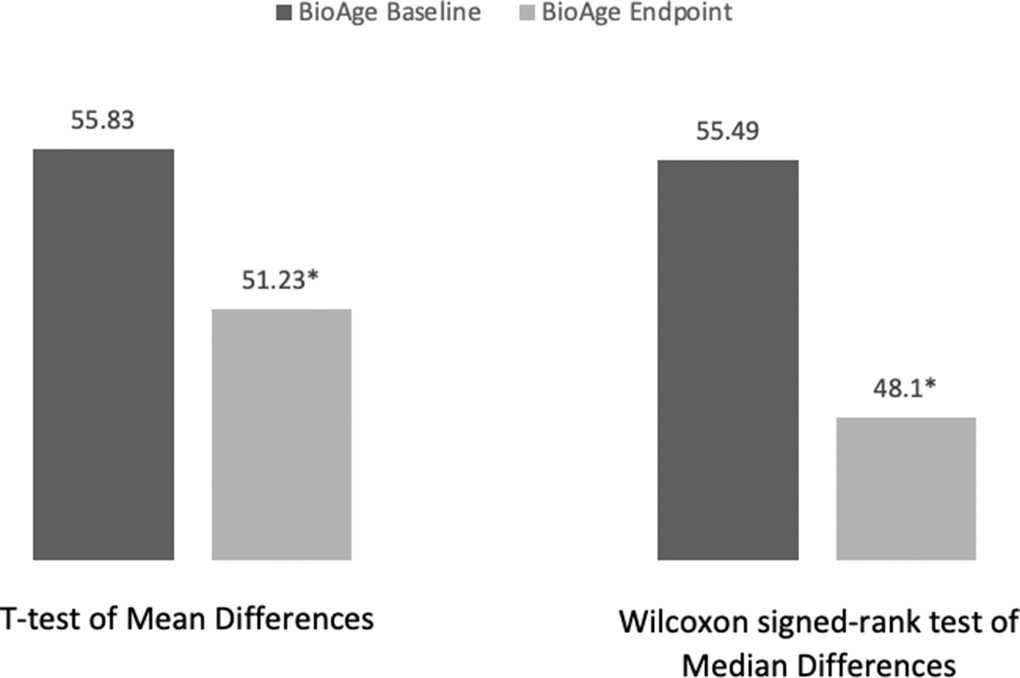
Figure 1.
Participants’ average biological age change analysis.
*Significant difference with p-value < .05.
Figure 1 — Potential reversal of biological age in women following an 8-week methylation-supportive diet and lifestyle program: a case series | Aging