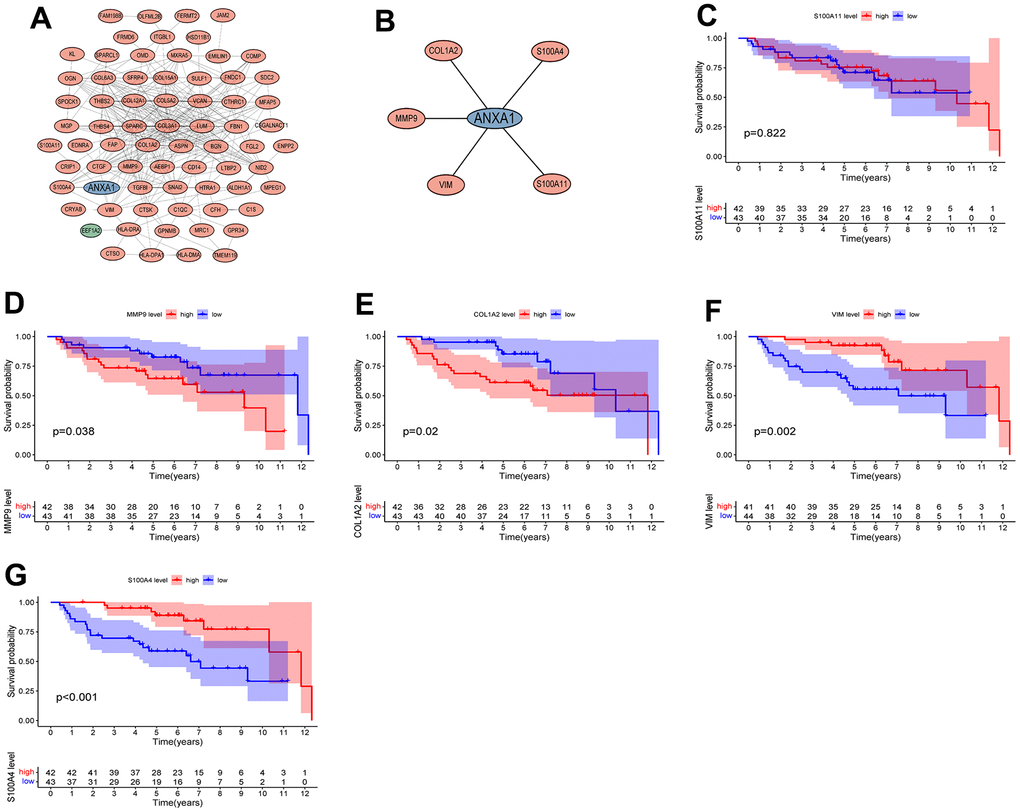
Figure 6.Protein interaction network diagram and survival curves of module genes. (A) The module with the highest MCODE score. (B) The module associated with AXNA1. Red indicates upregulated genes, green indicates downregulated genes, and hub gene is indicated in blue. The expressions of ANXA1-related module genes used to construct the prognosis of ES. (C) S100A11; (D) MMP9; (E) COL1A2; (F) VIM; (G) S100A4. P values <0.05 indicated that differences were significantly significant.