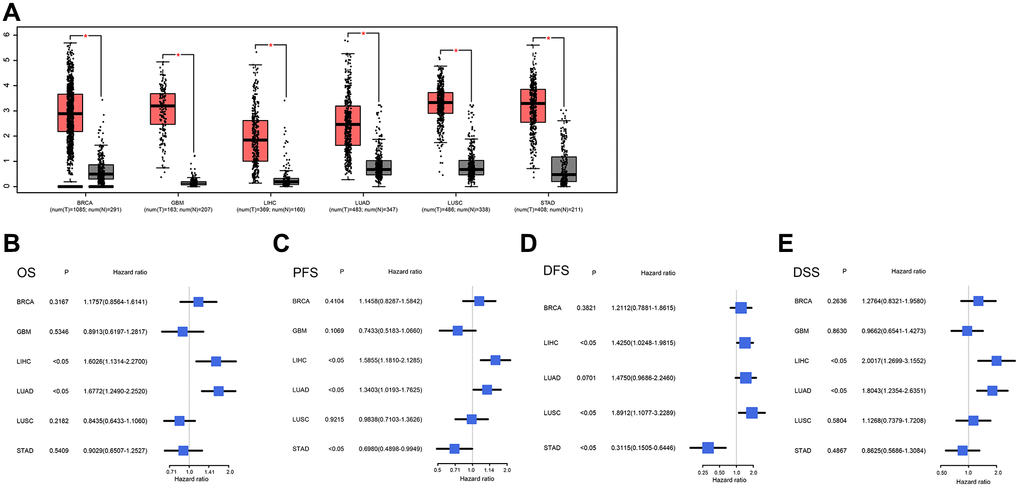
Figure 5.(A) Expression levels of NCAPG in cancer tissues and normal tissues in GEPIA2. From left to right are gastric cancer (STAD), lung cancer (LUAD), liver cancer (LIHC), glioma (GBM) and breast cancer (BRCA). The red box represents the expression level of NCAPG in cancer tissues; the gray box represents the expression level of NCAPG in normal tissues, the screening criteria were log2FC|>1 and P < 0.01, (B) OS of BRCA, GBM, LIHC, LUAD, LUSC and STAD, (C) PFS of BRCA, GBM, LIHC, LUAD, LUSC and STAD, (D) DFS of BRCA, LIHC, LUAD, LUSC and STAD, (E) BRCA, GBM, LIHC, LUAD, LUSC and STAD's DSS.