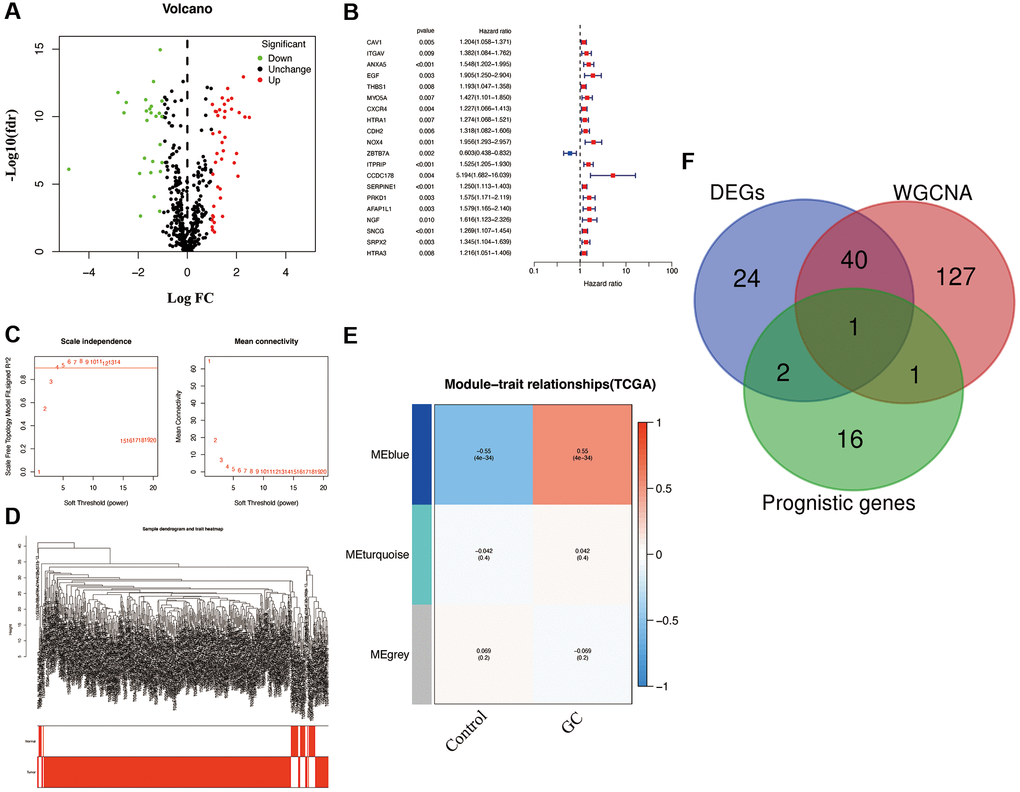
Figure 1.Characterization of candidate AGs in GC. (A) Volcano plot of differentially expressed AGs with FDR < 0.05 and |logFC| > 1. (B) Univariate Cox regression analysis showed prognostic AGs with p < 0.01. (C) Soft-thresholding powers scale-free fit index. (D) Clustering dendrogram of GC samples. (E) Heatmap showing the correlation between clinical traits and gene module. Each module was assigned with different colors. The correlation coefficient decreased in size from red to blue. (F) The Venn diagram of genes among DEGs, prognostic genes, and WGCNA lists.