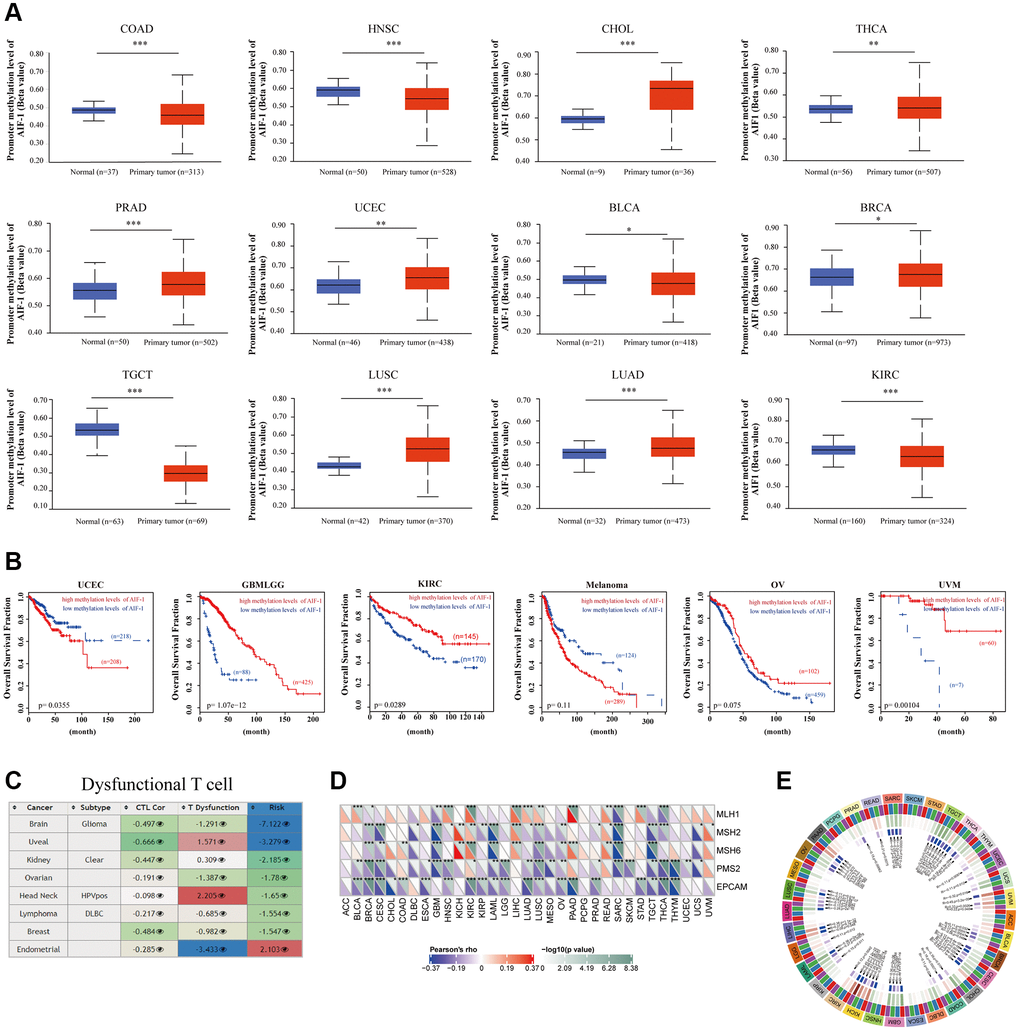
Figure 9.Correlation analysis with methylation profile. (A) Boxplots showing differential AIF-1 methylation levels (beta values) between tumors and adjacent tissues across the TCGA dataset. (B) Kaplan-Meier curves of OS differences between TCGA cancer cohorts with high methylation levels and those with low methylation levels of AIF-1. Only cancers with statistically significant differences between cohorts are presented. (C) Heatmap showing the roles of AIF-1 methylation in cytotoxic T-cell levels (CTLs), dysfunctional T-cell phenotypes, and risk factors in TCGA cancer cohorts. (D) Correlation between AIF-1 expression level and the expression of five MMR genes. The left bottom triangle in each unit denotes the coefficient of association calculated by Pearson’s correlation test. The top right triangle indicates the P value. (E) Correlation between AIF-1 expression level and four methyltransferase genes (DNMT1: red; DNMT2: blue; DNMT3A: green; DNMT3B: purple).