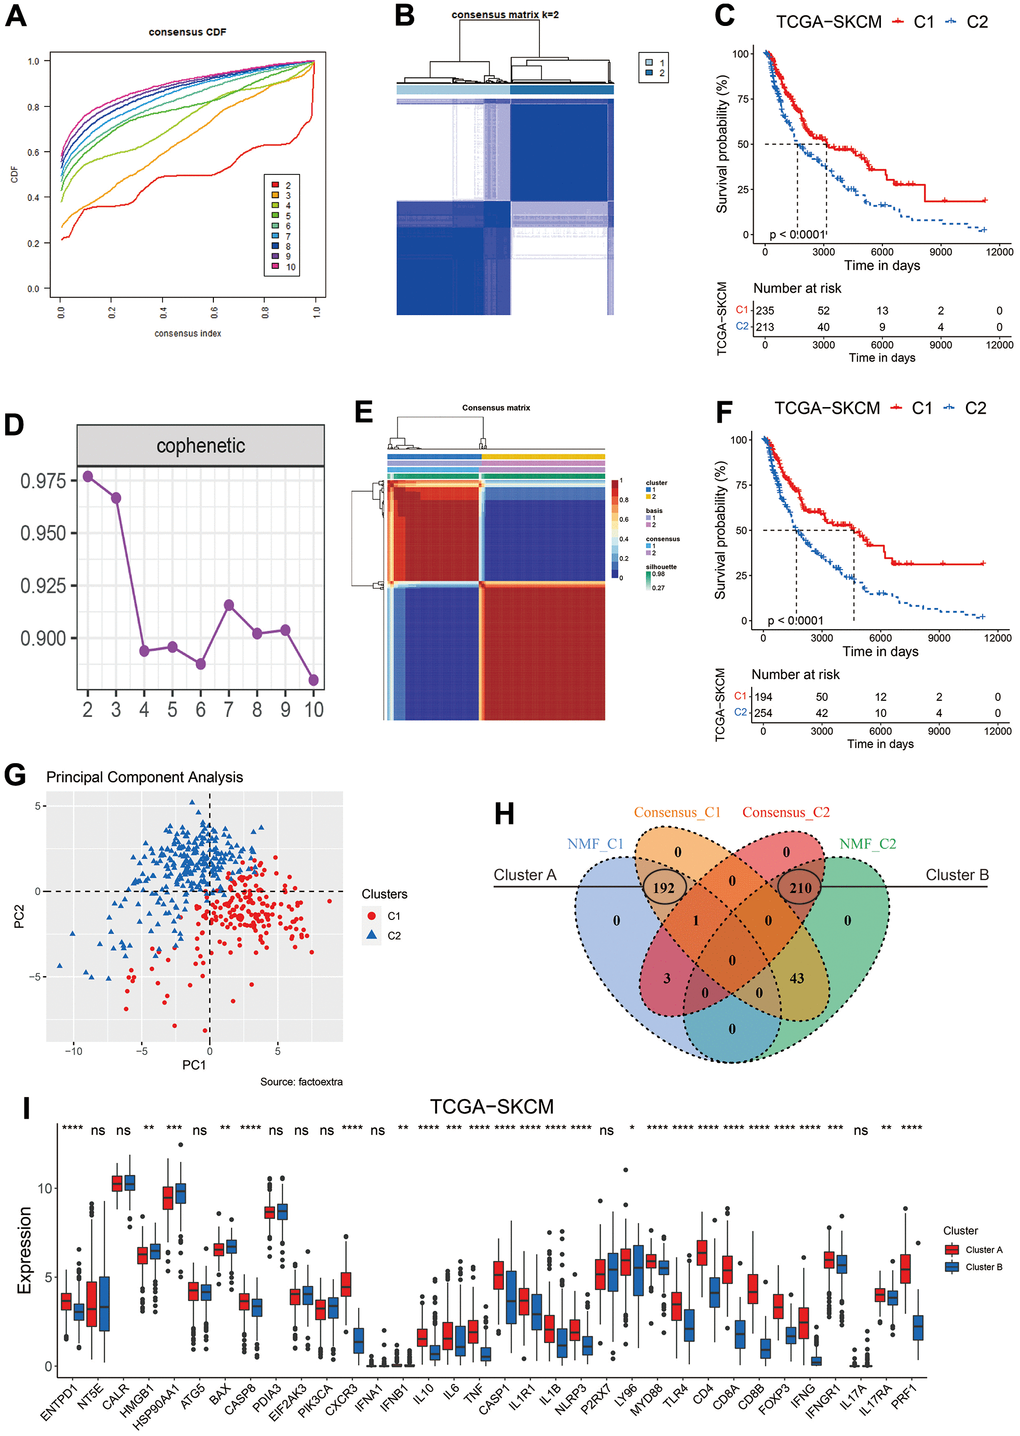
Figure 2.Clustering of melanoma patients based on ICD related genes. (A) The cumulative distribution function (CDF) curve of consensus clustering for k = 2 to 10. (B) Heatmap depicts consensus clustering solution (k = 2) for 34 ICD related genes in melanoma patients from the TCGA-SKCM dataset. (C) Kaplan–Meier curves of OS in the C1 and C2 subtypes (the consensus clustering method) of melanoma patients. (D) The optimal rank was selected as 2 since the cophenetic coefficient firstly started decreasing at this point. (E) Heatmap of NMF clustering results of melanoma patients from the TCGA-SKCM dataset. (F) Kaplan–Meier curves of OS in the C1 and C2 subtypes (the NMF method) of melanoma patients. (G) Principal component analysis (PCA) on the expression level of 34 ICD related genes in clusters classified by NMF method. (H) Venn diagram to identify melanoma patients in the C1 cluster (Cluster A) and C2 cluster (Cluster B) defined by both clustering methods. (I) Gene expression comparison of 34 ICD related genes between Cluster A and B in the TCGA-SKCM cohort. Ns, not significant; *p < 0.05; **, p < 0.01; ***, p < 0.001; ****, p < 0.0001.