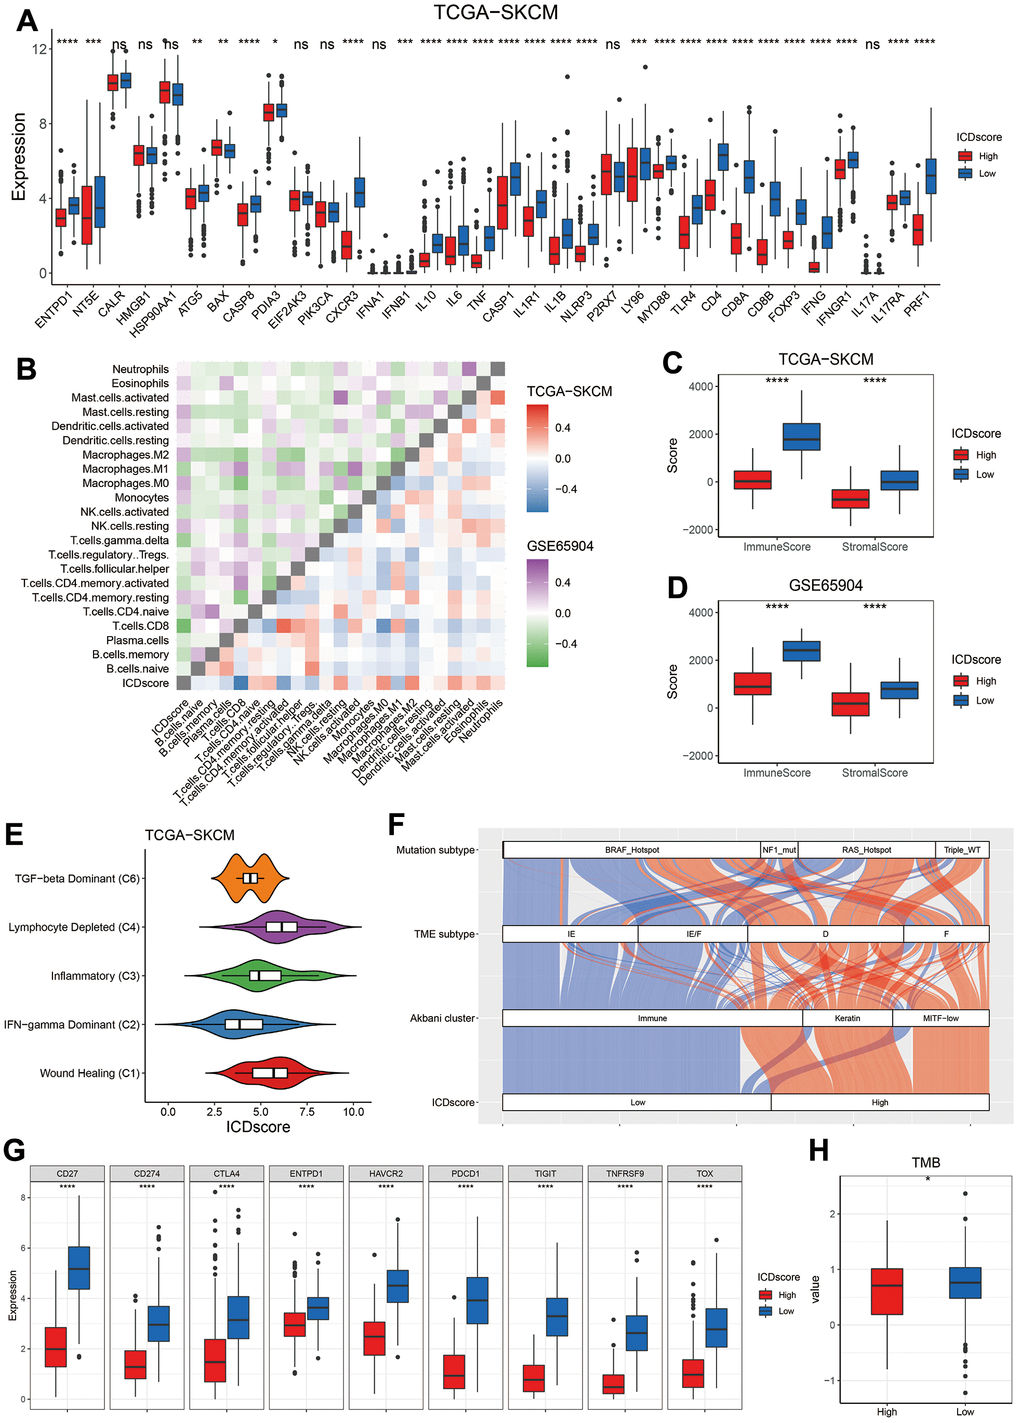
Figure 5.Immune profile of ICDscore-based classification. (A) Gene expression comparison of 34 ICD related genes between ICDscore-high and ICDscore-low subgroups in the TCGA-SKCM cohort. (B) Correlation analyses between ICDscore and infiltration level of 22 immune cells in the TCGA-SKCM and GSE65904 datasets. (C, D) Comparison of immunescore (C) and stromalscore (D) between ICDscore-high and ICDscore-low subgroups in the TCGA-SKCM and GSE65904 datasets. (E) Box plot showing a difference in the value of ICDscore across the five subtypes for melanoma patients in the TCGA_SKCM dataset. (F) Sankey diagram showed the connection degree between ICDscore-based classification and Akbani cluster, TME subtype and mutation subtype in the TCGA-SKCM dataset. (G) Box plot showing a difference in the expression of multiple exhausted T cell markers or immune-checkpoint markers between ICDscore-high and ICDscore-low subgroups in the TCGA-SKCM cohort. (H) Box plot showing a difference in the TMB between ICDscore-high and ICDscore-low subgroups in the TCGA-SKCM cohort. Ns, not significant; *p < 0.05; **, p < 0.01; ***, p < 0.001; ****, p < 0.0001.