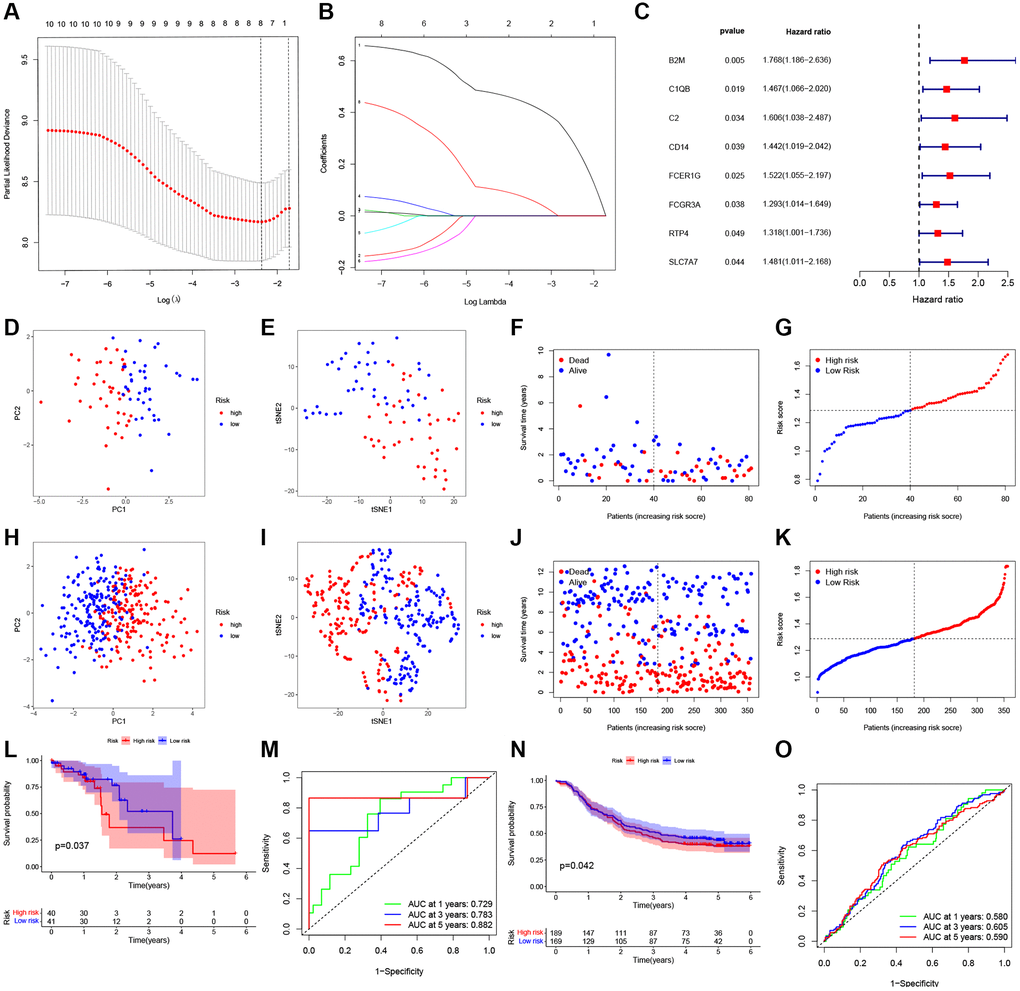
Figure 3.Construction of a prognostic ESCC model. (A) Distribution of LASSO coefficients for eight genes. Two vertical lines represent lambda. min and lambda. Lse. (B) Coefficients for eight genes analyzed by LASSO. (C) The hazard ratio of univariate Cox analysis for pyroptosis-related DEGs. (D) PCA plot for ESCC based on the risk score in TCGA. (E) tSNE plot for ESCC based on the risk score in TCGA. (F, G) Distribution of risk score, survival status in TCGA. (H) PCA plot for ESCC based on the risk score in GEO. (I) tSNE plot for ESCC based on the risk score in GEO. (J, K) Distribution of risk score, survival status in GEO. (L) Survival analysis to verify the prognostic model in TCGA. (M) Time-dependent ROC curves for ESCC in TCGA. (N) Survival analysis to verify the prognostic model in GEO. (O) Time-dependent ROC curves for ESCC in GEO.