


Introduction
Esophageal cancer (EC) ranks 6th among all factors inducing cancer-associated mortality worldwide and exhibits a growing incidence. EC is divided into esophageal adenocarcinoma and esophageal squamous cell carcinoma (ESCC). In Asia, ESCC represents a predominant histological subtype [1]. ESCC patients still have a dismal prognosis despite great progress in treatments. Moreover, some ESCC cases develop resistance to targeted therapies, immunotherapy, and chemotherapy, leading to cancer recurrence and mortality [2, 3]. Such cases of treatment failure may be caused by ESCC heterogeneity [4, 5]. Therefore, identifying ESCC subtypes is of great significance for predicting patient prognostic outcomes and developing individualized treatments.
Pyroptosis is a form of gasdermin-mediated programmed cell death that causes persistent swelling of cells when the cytomembrane ruptures, leading to cellular content leakage [6, 7]. Cancer cells can generate massive antigens during pyroptosis that induce systemic immunity and inhibit cancer growth [8]. Moreover, Gasdermin E (GSDME), a crucial pyroptosis-related protein, induces tumor adaptive immunity by promoting macrophage-mediated phagocytosis, thereby adding to the difficulty of immune evasion of cancer cells [9, 10]. Immune cells infiltrate more readily into GSDME over-expressing tumors compared to GSDME-deficient ones [7, 9]. Therefore, pyroptosis is a significant direction of antitumor therapy. However, there are few studies on the relationship of ESCC prognosis with pyroptosis-related gene (PRG) levels [11], and no further study has been conducted to stratify ESCC into different molecular subtypes to explore the relationship with immune response.
With the development of high-throughput sequencing (HTS), we have gained a comprehensive understanding of tumor gene expression patterns, and ESCC cases show great heterogeneity in the prognosis of combined immunotherapy, and it is greatly significant to provide personalized therapy for subtype classification of patients with ESCC [12, 13]. The present study conducted preliminary research to identify ESCC-related PRGs subtypes based on HTS data. This study investigated the functions of pyroptosis in diverse subtypes, which is beneficial for diagnosis, prognosis, and individualized treatment for ESCC cases.
Materials and Methods
Datasets and patients
We obtained mRNA expression profiles (Workflow Type: HT seq-FPKM) and matched clinical data of ESCC cases at the Cancer Genome Atlas (TCGA) website (https://portal.gdc.cancer.gov/repository) as a training cohort. Simultaneously, 99 ESCC case samples (including 11 healthy and 88 ESCC tissue samples) were also obtained. The GSE53625 dataset of Gene Expression Omnibus (GEO) (http://www.ncbi.nlm.nih.gov/geo/) was adopted to be a validation cohort. There were 275 ESCC cases enrolled altogether, excluding adenocarcinoma, and their details are in Table 1. This work adopted Affymetrix Human Genome U133 Plus 2.0 Array platform to study GEO samples. Clinicopathological characteristics (age, sex, grade, TNM stage, tobacco, alcohol) of cases were also extracted. Samples without detailed clinical or prognostic information were eliminated from these two databases.
Table 1. Clinical information of ESCC patients from TCGA and GEO.
| TCGA | GEO | ||
| n = 96 | n = 179 | ||
| Age | ≥60 | 39 | 90 |
| <60 | 57 | 89 | |
| Gender | Female | 15 | 33 |
| Male | 81 | 146 | |
| T | T1~2 | 41 | 39 |
| T3~4 | 55 | 140 | |
| N | N0 | 52 | 83 |
| N1~2, x | 44 | 96 | |
| M | M0 | 86 | 179 |
| M1, x | 10 | 0 | |
| Stage | Stage I | 7 | 10 |
| Stage II | 57 | 77 | |
| Stage III | 27 | 92 | |
| Stage IV | 5 | 0 | |
DEGs identification
We obtained 27 PRGs in Gene Set Enrichment Analysis (GSEA) (https://www.gsea-msigdb.org/gsea). Their expression patterns were obtained from the TCGA database. Moreover, DEGs were identified using the R software “limma” package with a P < 0.05 threshold. Furthermore, potential gene-gene interactions were searched, and the DEGs-based protein-protein interaction (PPI) network was built based on the STRING database (http://string-db.org/).
Risk score model establishment based on univariate Cox as well as LASSO Cox regression
This work conducted univariate regression to screen the prognostic PRGs upon the threshold of P < 0.2 to prevent omissions. Additionally, the R software “glmnet” function was utilized for LASSO analysis to construct a risk score model upon univariate regression. Later, our constructed model was adopted to determine the risk score for every ESCC case, and the median was adopted to classify cases as high- or low-risk groups. A forest was used to show the P-value, HR and 95% CI of each gene through the “forestplot” R package. Thereafter, the R software “stats” package was applied in PCA and tSNE.
Functional annotation and changes in eight genes incorporated into the model
This work utilized the cBioPortal (https://www.cbioportal.org) dataset containing genome information of 104 cancer types for examining genetic variations of those genes incorporated into the model. GeneMANIA (http://www.genemania.org) provides genetic data, gene list information, functional annotation of key genes, and algorithms with great prediction ability. Hence, we adopted GeneMANIA for analyzing genes related to gene models and enrichment activities.
Associations between genes/risk score and clinicopathological factors/immune cells/immune pathways
This study utilized the R package “beeswarm” function for evaluating the associations between genes/risk score and clinicopathological factors. Notably, the tumor immune microenvironment (TIME) represents an essential factor for antitumor immunity in the tumor. ssGSEA was conducted using the R package “gsva” function for calculating tumor-infiltrating immune cells (TIICs) scores and evaluating activities of immune pathways.
Quantitative real-time PCR (qRT-PCR)
TRIzol reagent (Invitrogen, CA, USA) was used for extracting total RNA, which was later prepared into cDNA using the Prime Script RT Master Mix (TaKaRa, China). Thereafter, qRT-PCR was performed using SYBR Premix Ex Taq II (TaKaRa, China) for detecting target mRNA expression, while Bio-Rad CFX Manager software (Bio-Rad, USA) was used for data analysis, using GAPDH as the endogenous reference. Primer preparation was performed by Tsingke Biotechnology Co., Ltd. (China) 2−ΔCt approach was employed for assessing mRNA expression. The sequences of primers used in this study are listed in Table 2.
Table 2. Primers of genes.
| C2 | F: GGGGACAAGGTCCGCTATC |
| R: GAAGTCATAAGAGTAGGGTTGGC | |
| CD14 | F: ACGCCAGAACCTTGTGAGC |
| R: GCATGGATCTCCACCTCTACTG | |
| C1QB | F: ATGGGGCAGCATCCCAGTA |
| R: CTCCCTTCTCTCCGAACTCAC | |
| B2M | F: GAGGCTATCCAGCGTACTCCA |
| R: CGGCAGGCATACTCATCTTTT | |
| FCER1G | F: AGCAGTGGTCTTGCTCTTACT |
| R: TGCCTTTCGCACTTGGATCTT | |
| FCGR3A | F: CCTCCTGTCTAGTCGGTTTGG |
| R: TCGAGCACCCTGTACCATTGA | |
| RTP4 | F: ACATGGACGCTGAAGTTGGAT |
| R: TACGTGTGGCACAGAATCTGC | |
| SLC7A7 | F: CCCAAGGGTGTGCTCATATACA |
| R: CCAGTTCCGCATAACAAAGGG |
Statistical analysis
The statistical analysis was carried out using R version 4.0.5, GraphPad Prism 9.0.0, and Perl version 5.28. Excel Office 2019 was used for GEO and TCGA databases. In univariate regression, prognostic PRGs were selected at P < 0.2. The significance level was set at P < 0.05 for the rest of analysis.
Results
DEGs identification
In total, 12 PRGs were selected through TCGA database analysis (Figure 1A). There were several of these genes upregulated in tumors compared to healthy samples, including Gasdermin C (GSDMC), Tumor Protein P63 (TP63), Nucleotide Binding Oligomerization Domain Containing 2 (NOD2), GSDME, Interleukin 1 Alpha (IL1A), PYD And CARD Domain Containing (PYCARD), Absent in Melanoma 2 (AIM2), Caspase 1 (CASP1), Granzyme B (GZMB), Tumor Necrosis Factor (TNF) and NLR Family Pyrin Domain Containing 1 (NLRP1), whereas Elastase, Neutrophil Expressed (ELANE) were downregulated. Using STRING database, we constructed a PPI network that CASP1, TNF, IL1A, NLRP1, AIM2 NOD2, and PYCARD as critical genes interacting with additional genes (Figure 1B). Figure 1C demonstrates a correlation network that contains 12 PRGs.
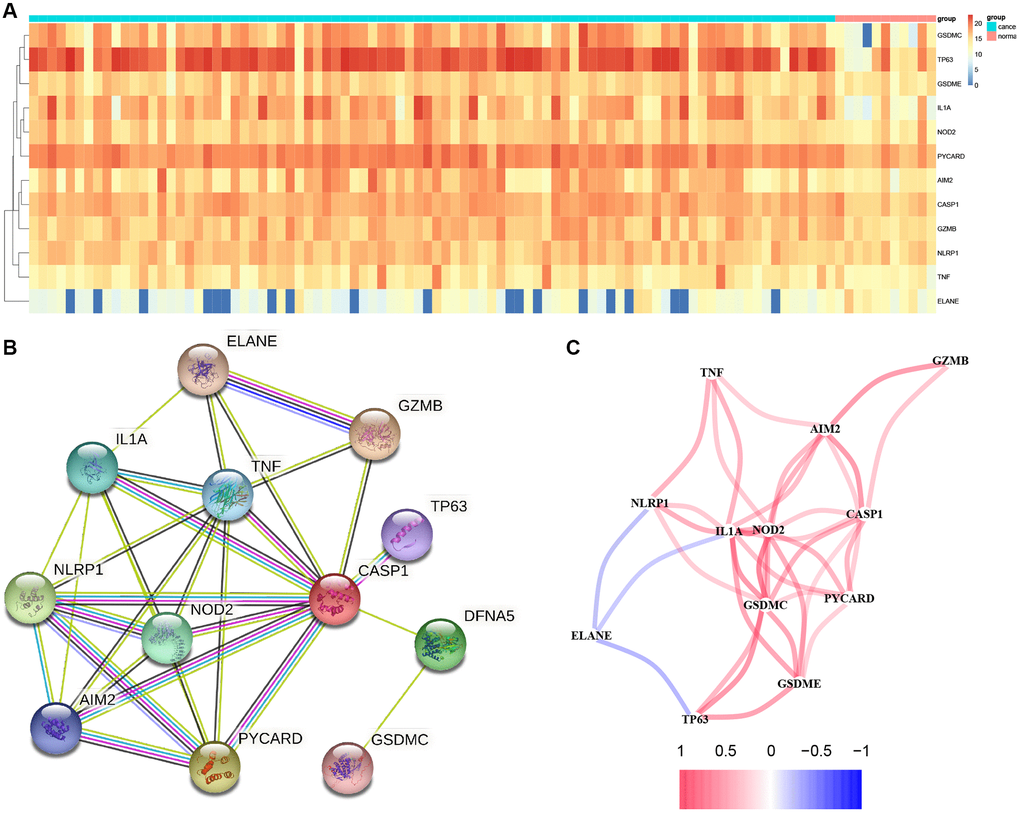
Figure 1. Results of differential gene analysis. (A) Heatmap of differentially expressed pyroptosis-related genes. The vertical axis refers to genes; the horizontal axis refers to differences in the gene expression between tissues, the red denotes high expression, and the blue denotes low expression. (B) PPI network showing the interactions of differentially expressed pyroptosis-related genes. (C) Correlation of the differentially expressed pyroptosis-related genes (Red line: Positive correlation; Blue line: Negative correlation. The depth of the colors reflects the strength of the relevance).
Tumor classification according to differentially expressed PRGs (DEPRGs)
This work conducted consensus clustering analysis for analyzing the relations of 12 PRGs with ESCC subtypes based on TCGA-derived cases, and cases with < 30-day follow-up time were eliminated. With an increase in the clustering variable (k = 2–10), there were the greatest and smallest intragroup and intergroup connections, respectively, found at k = 2, which indicated that ESCC cases were classified as two clusters based on 12 DEGs (Figure 2A). Moreover, we compared the overall survival (OS) of both clusters, which exhibited significant differences (Figure 2B).
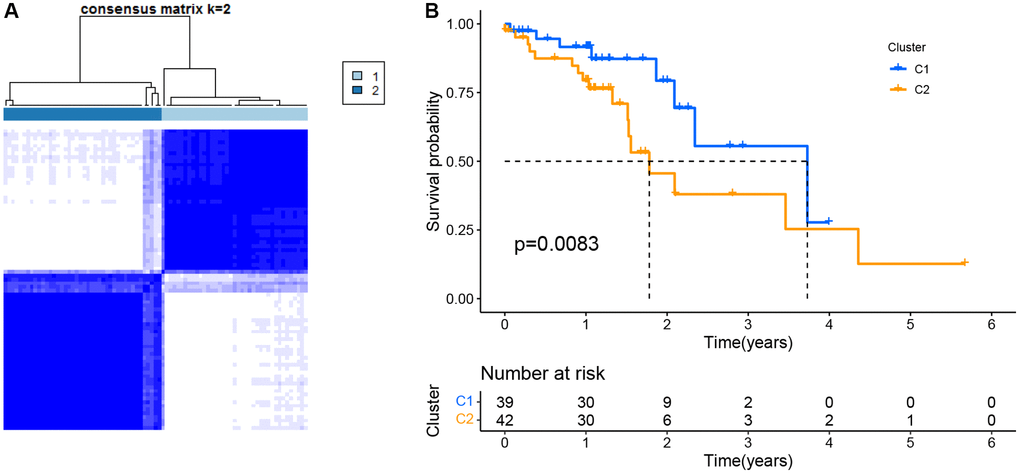
Figure 2. Tumor classification as per the pyroptosis-related DEGs. (A) ESCC patients were grouped into two clusters based on the consensus clustering matrix (k = 2). (B) Kaplan–Meier OS curves for the two clusters.
Risk score model
For the present study, we used LASSO Cox regression to develop a risk model based on those eight PRGs (Figure 3A, 3B), and calculated risk scores for each case as follows, risk score = β1 × ExpmRNA1 + β2 × ExpmRNA2 + … + βn × ExpmRNAn. Furthermore, this work conducted univariate Cox regression by incorporating those chosen DEPRGs based on 275 ESCC cases. At p = 0.2, there eight genes were discovered (Figure 3C). By using principal component analysis (PCA) and T-Distribution Stochastic Neighbour Embedding (tSNE), TCGA and GEO cases with diverse risks were grouped into 2 clusters (Figure 3D, 3E, 3H, 3I). With the increase in risk score value, the mortality risk elevated accordingly, while survival time was shortened (Figure 3F, 3G, 3J, 3K). Moreover, based on our validation dataset, our constructed PRGs-based risk model performed well in predicting the patient prognosis (Figure 3L, 3N). In TCGA, the AUC values of 1-, 3-, and 5-year ROC curves were 0.729, 0.783, 0.882, respectively (Figure 3M), whereas those in GEO were 0.580, 0.605, 0.590, respectively (Figure 3O).
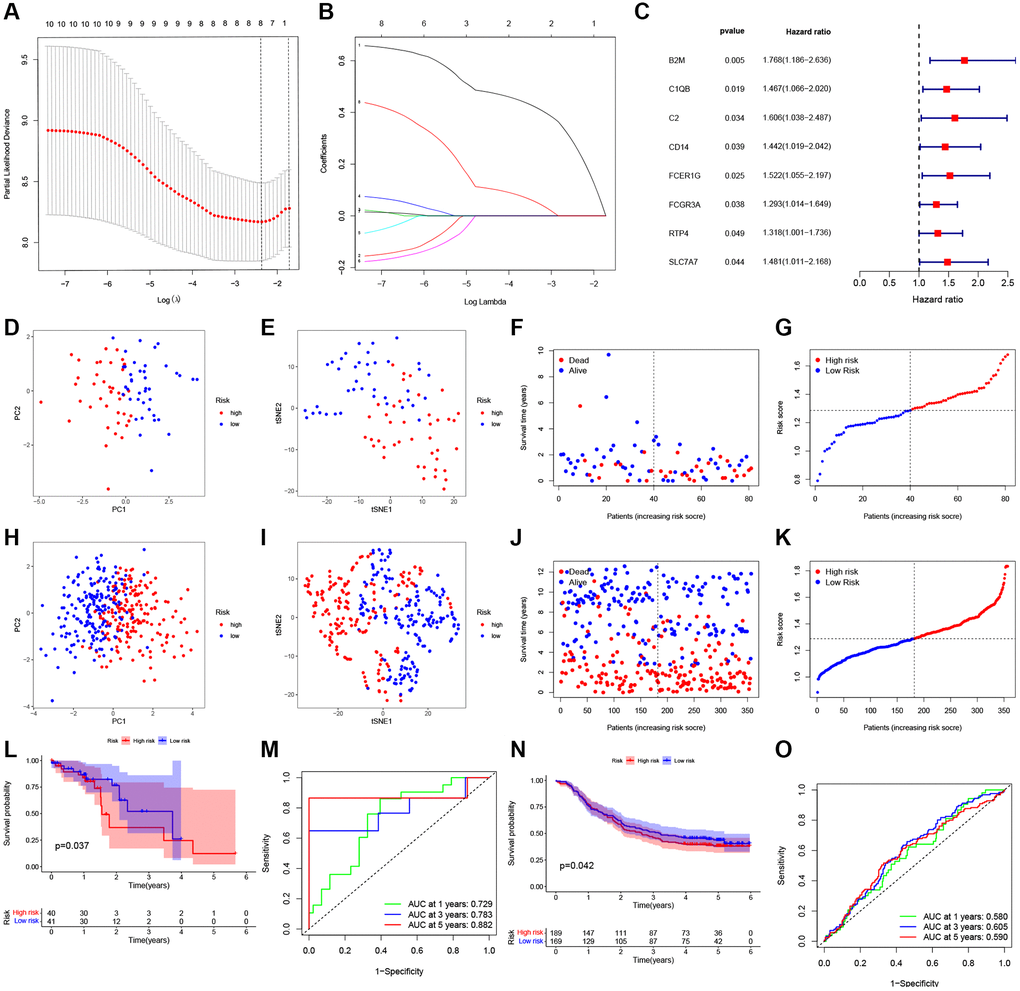
Figure 3. Construction of a prognostic ESCC model. (A) Distribution of LASSO coefficients for eight genes. Two vertical lines represent lambda. min and lambda. Lse. (B) Coefficients for eight genes analyzed by LASSO. (C) The hazard ratio of univariate Cox analysis for pyroptosis-related DEGs. (D) PCA plot for ESCC based on the risk score in TCGA. (E) tSNE plot for ESCC based on the risk score in TCGA. (F, G) Distribution of risk score, survival status in TCGA. (H) PCA plot for ESCC based on the risk score in GEO. (I) tSNE plot for ESCC based on the risk score in GEO. (J, K) Distribution of risk score, survival status in GEO. (L) Survival analysis to verify the prognostic model in TCGA. (M) Time-dependent ROC curves for ESCC in TCGA. (N) Survival analysis to verify the prognostic model in GEO. (O) Time-dependent ROC curves for ESCC in GEO.
Establishment of the PRG-based prognosis gene model
For constructing the prognosis gene model, this work used univariate Cox regression to select prognostic PRGs. Consequently, we detected eight prognostic PRGs altogether. Figure 4 represents K-M survival curves, indicating the dismal survival of ESCC. Cases showing upregulation of B2M (Figure 4A, P = 0.01), C1QB (Figure 4B, P = 6.4 × 10⁻³), C2 (Figure 4C, P = 0.002), CD14 (Figure 4D, P = 2.0 × 10⁻³), FCER1G (Figure 4E, P = 0.006), FCGR3A (Figure 4F, P = 6.8 × 10⁻³), RTP4 (Figure 4G, P = 0.03), SLC7A7 (Figure 4H, P = 0.02) are also represented.
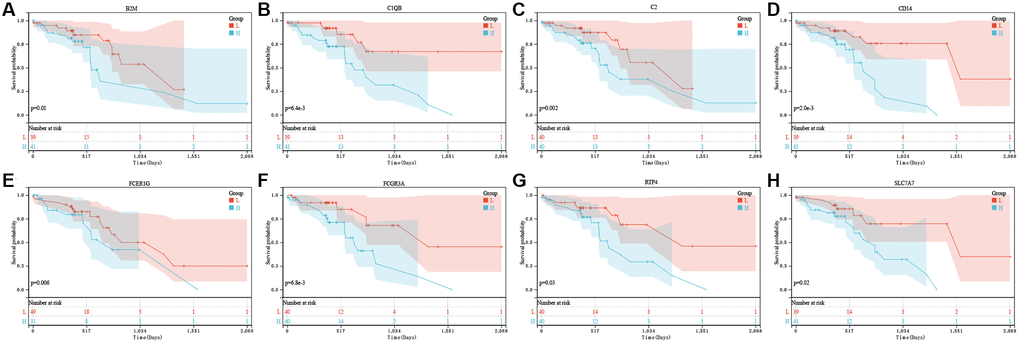
Figure 4. The prognostic value of eight pyroptosis-related genes in ESCC. In TCGA, the overall survival curve of B2M (A), C1QB (B), C2 (C), CD14 (D), FCER1G (E), FCGR3A (F), RTP4 (G), and SLC7A7 (H) in ESCC patients in the high-/low-expression group. PRG pyroptosis-related gene. Adjusted P-value < 0.05 is considered significant.
Univariate as well as multivariate Cox regression for risk score
Figure 5A represents eight gene expressions of ESCC cases and associated clinical data. Meanwhile, the heatmap described 12 diverse clinicopathological feature distributions depending on our risk model-determined risk scores of cases. Univariate and multivariate Cox regression was applied in assessing whether our as-constructed risk model independently predicted ESCC prognosis. According to Figure 5B–5E, our constructed risk model independently predicts ESCC prognosis.
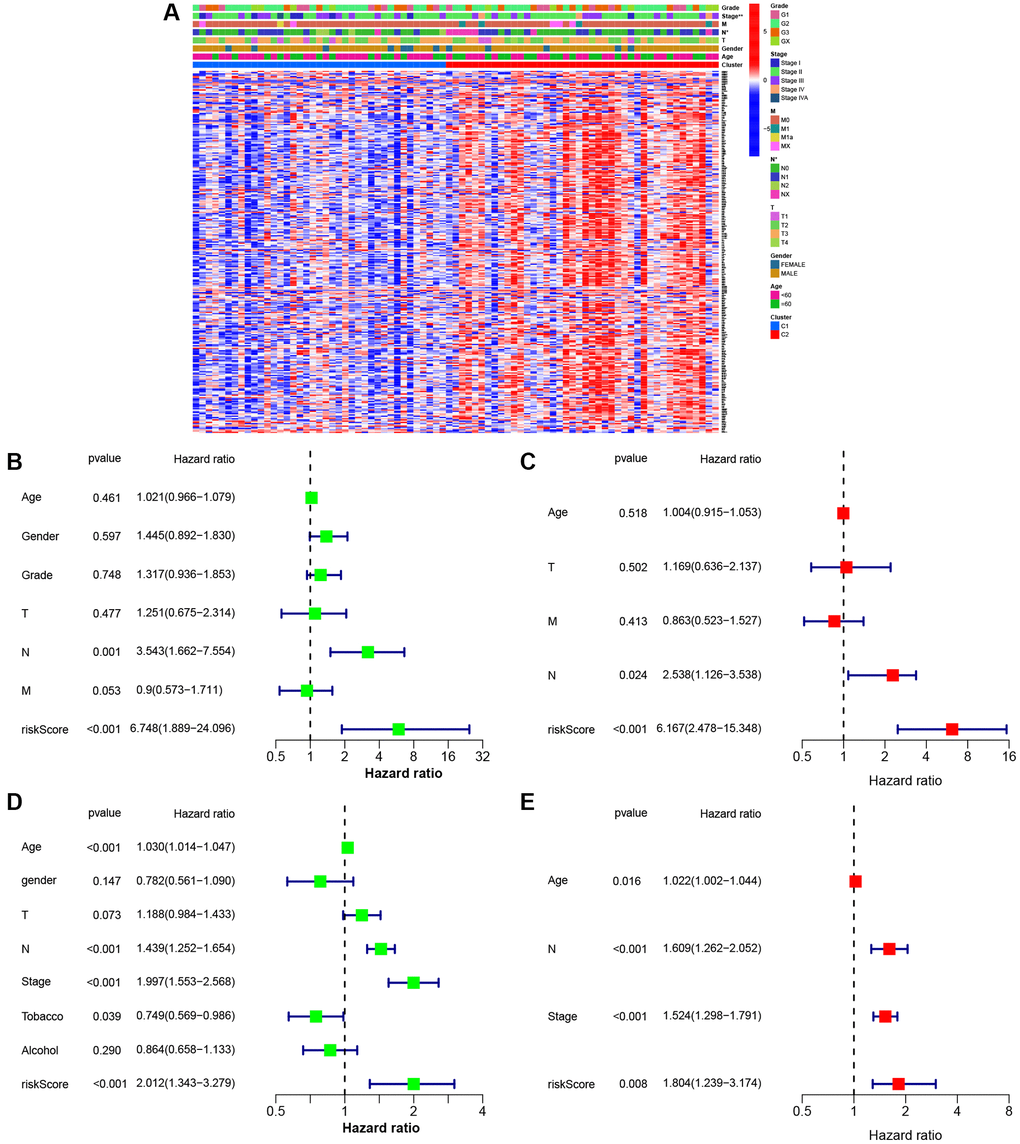
Figure 5. Univariate and multivariate Cox regression analyses for the risk score. (A) Heatmap (blue: low expression; red: high expression) for the connections between clinicopathological features and the risk groups (*P < 0.05). (B) Univariable Cox regression analysis for the risk score in TCGA. (C) Multivariable Cox regression analysis for the risk score in TCGA. (D) Univariable Cox regression analysis for the risk score in GEO. (E) Multivariable Cox regression analysis for the risk score in GEO.
Functional annotation and construction of the novel prognosis signature according to ESCC molecular subtypes
For better understanding functions of candidate genes and pathways across diverse molecular subtypes, 293 DEGs were obtained from the TCGA cohort upon the thresholds of |log2FC|≥1 and FDR < 0.05. Thereafter, the selected DEGs were subjected to GO functional annotation and KEGG pathway enrichment. Figure 6A and 6B represents significantly enriched biological processes (BPs). Therefore, DEGs were associated with several biological and cellular activities, like G protein-coupled receptor binding, the external side of the plasma membrane, response to the virus, ABC transporters, fatty acid degradation, metabolic pathways and so on.
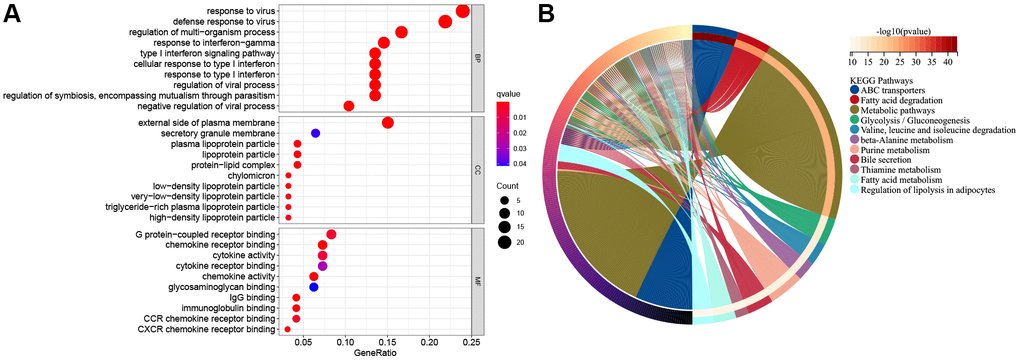
Figure 6. The functional enrichment analysis of pyroptosis-related genes in ESCC. (A) The enriched item in gene ontology analysis. The size of the circles represented the number of genes enriched. Abbreviations: BP: biological process; CC: cellular component; MF: molecular function; PRG: pyroptosis-related gene. The bigger bubble means more genes enriched, and the increasing depth of red denotes the differences were more obvious. q-value, the adjusted P-value. (B) The enriched item in Kyoto Encyclopedia of Genes and Genomes analysis.
Association between risk score and immune cells/immune function
All TCGA-derived cases were classified as high- or low-risk groups based on the median risk score value. ssGSEA was conducted to compare enrichment scores for 16 TIICs and activities of 13 immune pathways between both groups. In TCGA-derived cases, high-risk patients had increased TIIC levels of activated dendritic cells (aDCs), B cells, CD8+T cells, DCs, macrophages, mast cells, neutrophils, plasmacytoid dendritic cells (pDCs), T-helper cells, Th1-cells, Tfh, Tregs and tumor-infiltrating lymphocytes (TILs) (Figure 7A). Figure 7B shows the enrichment of immune-related functions for high-risk patients. High-risk patients were clearly associated with increased APC co-stimulation, checkpoint, CCR, HLA, cytolytic activity, parainflammation, inflammation-promoting, T cell-co-stimulation, T cell co-inhibition, Type I and Type II IFN responses. In GEO-derived cases, high-risk patients had increased TIIC levels of aDCs, B cells, DCs, macrophages, mast cells, neutrophils, Th1-cells, T-helper cells, Tregs, and TILs (Figure 7C). Figure 7D shows the enrichment of immune-related functions for high-risk patents. Clearly, high-risk patients were associated with the increased APC co-inhibition, checkpoint, CCR, parainflammation, inflammation-promoting, T-cell-co-stimulation, Type I and Type II IFN responses.
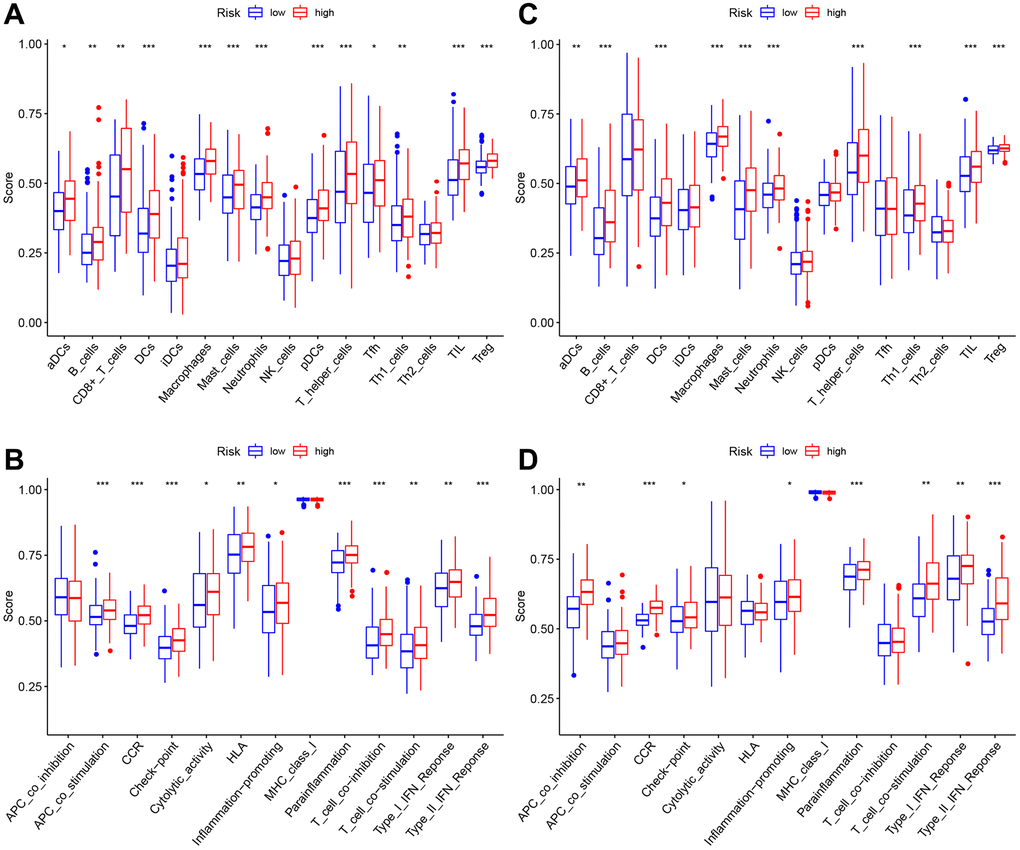
Figure 7. The immune landscape of two pyroptosis-related molecular subtypes. (A, B) Comparison of the enrichment scores of 16 types of immune cells and 13 immune-related functions between low- (blue box) and high-risk (red box) groups in the TCGA cohort, (C, D) Comparison of the enrichment scores of 16 types of immune cells and 13 immune-related functions between low- (blue box) and high-risk (red box) groups in the GEO cohort. Adjusted P-values were shown as ns (not significant); *P < 0.05; **P < 0.01; ***P < 0.001.
Eight genes expression at mRNA levels
As confirmed by ESCC cells (KYSE410, KYSE510) and normal epithelium of esophagus (HET-1A) obtained from Hunan Fenghui Biotechnology Co., Ltd. (Changsha, China) through qPCR, C2, CD14, RTP4, FCER3A, and SLC7A7 were highly expressed in KYSE410 and KYSE510 than normal cells (Figure 8A–8H). The expression of B2M, C1QB, and FCER1G did not show a significant difference, which could be a result of individual variability requiring an increased sample size.
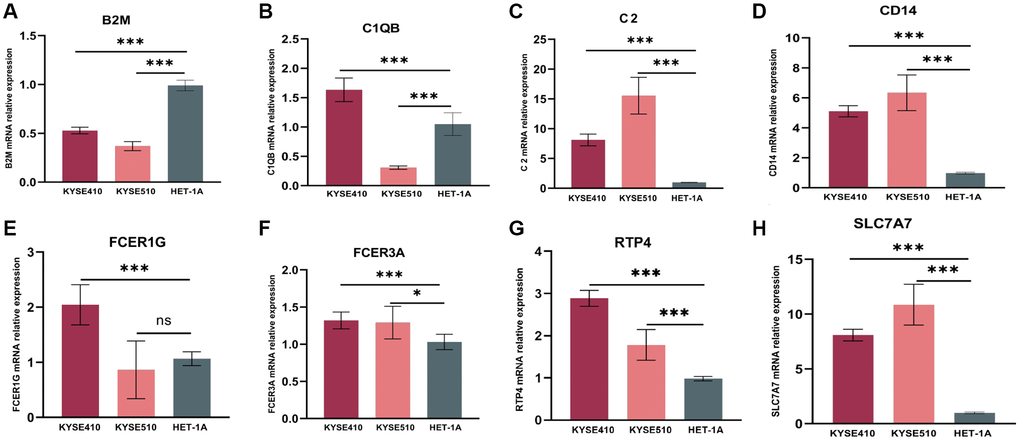
Figure 8. mRNA relative expression of genes in the risk model by the method of qPCR. (A) mRNA relative expression of B2M. (B) C1QB. (C) C2. (D) CD14. (E) FCER1G. (F) FCER3A. (G) RTP4. (H) SLC7A7. GAPDH expression was used as an internal control. qPCR, quantitative real-time polymerase chain reaction.
Discussion
The findings suggested that the PRG-based gene risk model might be adopted for predicting ESCC prognosis. Also, our as-constructed risk model was associated with clinicopathological characteristics, immune cells, as well as immune activities. Pyroptosis represents a novel type of programmed cell death that has been widely investigated in a number of disorders in recent years [14]. It may result from canonical caspase-1 inflammasomes or from caspase-4/5/11 activation by cytosolic lipopolysaccharide [15]. Pyroptosis may affect cancer growth, migration, and invasion [16]. The effects of GSDME and Gasdermin A3 (GSDMA3) on suppressing cancer proliferation by promoting cytotoxic responses of lymphocytes are reported [12]. After chemotherapy, the degradation of GSDME by caspase-3 can cause some cancer cells to scorch death [17]. PD-L1 can alter TNFα-mediated tumor cell apoptosis into pyroptosis, leading to tumor necrosis [18]. When ESCC is treated with DHA, certain dying cells show the typical pyroptosis morphologies, such as blowing huge bubbles from the cell membrane, accompanied by reduced expression of pyruvate kinase isoform M2 (PKM2), GSDME, and caspase-3/8 activation, together with GSDME-NT generation [19]. Cisplatin exposure increased ROS levels, which activated GSDME and caspase-3 and promoted ESCC cell pyroptosis [20]. PDT inhibited PKM2 expression, thereby activating caspase-3/8 and releasing N-GSDME while triggering ESCC pyroptosis [21]. BI2536 (PLK1 inhibitor) can enhance the DDP sensitivity of ESCC cells by promoting pyroptosis while suppressing the DNA damage repair pathway. A combination of BI2536 and DDP treatment led to ESCC cell pyroptosis via the caspase-3/GSDME pathway [22]. Metformin induces ESCC pyroptosis via miR-497/PELP1 pathway [23]. Disruption of circPUM1 resulted in pyroptosis of ESCC cell lines [24]. These studies suggested that many chemotherapies and targeted drugs work by causing ESCC cells to pyroptosis, and PRGs are possible biomarkers for ESCC. However, there is few article using PRGs for constructing the risk model of ESCC. In this work, the TCGA dataset was used to be the training set, whereas the GEO dataset to be the validation set for constructing an eight PRGs-based risk model based on univariable as well as LASSO Cox regression. Therefore, our prognostic model predicted prognosis well, which could be useful for clinical assessment and discovering novel therapeutic targets. Genes incorporated into our as-constructed risk model are recognized in cancer research. β2-microglobulin (B2M) mutation is found to be the immune escape genetic mechanism in anti-programmed cell death protein 1 (PD-1) treatment [25]. HLA class I antigen deletion caused by B2M mutation mostly occurs under the activated PDCD1 (PD-1)-positive T cell infiltration condition [26]. C1QB is the diagnostic and prognostic biomarker for skin cutaneous melanoma patients [27], IRF4 could promote melanoma cell growth via upregulating C1QB [28]. The combination of C2 and additional therapeutic mAbs, such as type II anti-CD20/CD22/CD38 samples, can overcome complement attack resistance in tumor cells [29]. Genetic variability in CD14 may play a role in developing gastric cancer precursor lesions over time and in gastric carcinogenesis [25]. PD-L1 CD14 monocytes are markedly associated with OS of different cancers after anti-PD-1 blockade treatments [30]. CD14+ monocytes from peripheral blood in renal cell carcinoma (RCC) cases show remarkable phenotypic changes, which are five times greater than the mean value found in normal subjects. CD14+ cells present around and inside the tumor might independently predict the patient prognosis [31]. Cancer cells with high CD14 expression show increased amounts of many inflammatory factors, resulting in greater tumor formation than cells with low CD14 expression. The inflammatory factors generated by the high CD14 expression bladder cancer cells recruit and polarize macrophages and monocytes to acquire immune-suppressive characteristics. Bladder cancer cells with high CD14 can mediate tumor-promoting inflammation while driving cancer cell growth for promoting tumor development [32]. The expression of FCER1G increases within many cancers. FCER1G expression was positively associated with tumor prognostic outcome, growth, and migration; also, FCER1G was closely related to tumor immunity and tumor microenvironment (TME) [33]. FCGR3A usually shows upregulated in pan-cancer [34]. In survival analysis, FCGR3A has been found to be a major risk factor for many tumors [35]. Besides, FCGR3A expression is associated with infiltrating degrees of certain immune cells [36], levels of DNA mismatch repair genes, and numerous immune checkpoint genes. Based on the drug sensitivity analysis, FCGR3A upregulation predicts the decreased IC50 values of many drugs [34]. RTP4 depends on the infiltrating degrees of immune cells. Furthermore, it showed a close association with genes that encode immune checkpoint components (PDCD1, LAG3, TIM-3) [37]. Glioma risk may be affected by SLC7A7 genetic variants [38]. Based on the above findings, we identified eight PRGs related to the tumor. Our risk model built using these PRGs was associated with the infiltrating degrees of immune cells (such as neutrophils and macrophages). Thus, our as-constructed risk model is associated with TME and could be used to predict ESCC prognosis. However, there are some limitations associated with it. Firstly, this risk model needs to be further validated with more data. Secondly, certain PRGs incorporated in this model should be validated with more samples, and their underlying mechanisms ESCC should be further explored.
In summary, this work suggested that PRGs were differentially expressed in healthy compared with ESCC samples. Furthermore, according to eight PRGs, our constructed risk score independently predicts the prognosis of ESCC. Therefore, our findings contribute to identifying early cases and offer candidate novel antitumor therapeutic targets.
Author Contributions
Study design and concept: Yan XL, Ma ZQ, and Duan WX. Data acquisition: Pan MH, Wang YY, Wang ZY, Shao CJ, Feng YT, Ding P, and Duan HT. Data analysis and interpretation: Pan MH, Wang YY, Wang ZY, Shao CJ, Feng YT, Ding P, and Duan HT. Manuscript preparation: Pan MH, Wang YY, Wang ZY, Shao CJ, Feng YT, Ding P, Duan HT, and Ren XY. All authors read and approved the final manuscript.
Conflicts of Interest
The authors declare no conflicts of interest related to this study.
Funding
This work was supported by the National Natural Science Foundation of China (82173252, 81871866), the Shaanxi Special Support Plan-Program for Leading Talents of Science and Technology Innovation (No. 2019 Special Support Plan), the Shaanxi Social Development Science and Technology Key Project (2022SF-145).
References
- 1. Sung H, Ferlay J, Siegel RL, Laversanne M, Soerjomataram I, Jemal A, Bray F. Global Cancer Statistics 2020: GLOBOCAN Estimates of Incidence and Mortality Worldwide for 36 Cancers in 185 Countries. CA Cancer J Clin. 2021; 71:209–49. https://doi.org/10.3322/caac.21660 [PubMed]
- 2. Shen L, Kato K, Kim SB, Ajani JA, Zhao K, He Z, Yu X, Shu Y, Luo Q, Wang J, Chen Z, Niu Z, Zhang L, et al, and RATIONALE-302 Investigators. Tislelizumab Versus Chemotherapy as Second-Line Treatment for Advanced or Metastatic Esophageal Squamous Cell Carcinoma (RATIONALE-302): A Randomized Phase III Study. J Clin Oncol. 2022; 40:3065–76. https://doi.org/10.1200/JCO.21.01926 [PubMed]
- 3. Wang ZX, Cui C, Yao J, Zhang Y, Li M, Feng J, Yang S, Fan Y, Shi J, Zhang X, Shen L, Shu Y, Wang C, et al. Toripalimab plus chemotherapy in treatment-naïve, advanced esophageal squamous cell carcinoma (JUPITER-06): A multi-center phase 3 trial. Cancer Cell. 2022; 40:277–88.e3. https://doi.org/10.1016/j.ccell.2022.02.007 [PubMed]
- 4. Duan H, Shao C, Pan M, Liu H, Dong X, Zhang Y, Tong L, Feng Y, Wang Y, Wang L, Newman NB, Sarkaria IS, Reynolds JV, et al. Neoadjuvant Pembrolizumab and Chemotherapy in Resectable Esophageal Cancer: An Open-Label, Single-Arm Study (PEN-ICE). Front Immunol. 2022; 13:849984. https://doi.org/10.3389/fimmu.2022.849984 [PubMed]
- 5. Smyth EC, Gambardella V, Cervantes A, Fleitas T. Checkpoint inhibitors for gastroesophageal cancers: dissecting heterogeneity to better understand their role in first-line and adjuvant therapy. Ann Oncol. 2021; 32:590–9. https://doi.org/10.1016/j.annonc.2021.02.004 [PubMed]
- 6. Wei X, Xie F, Zhou X, Wu Y, Yan H, Liu T, Huang J, Wang F, Zhou F, Zhang L. Role of pyroptosis in inflammation and cancer. Cell Mol Immunol. 2022; 19:971–92. https://doi.org/10.1038/s41423-022-00905-x [PubMed]
- 7. Tan Y, Chen Q, Li X, Zeng Z, Xiong W, Li G, Li X, Yang J, Xiang B, Yi M. Pyroptosis: a new paradigm of cell death for fighting against cancer. J Exp Clin Cancer Res. 2021; 40:153. https://doi.org/10.1186/s13046-021-01959-x [PubMed]
- 8. Peng J, Xiao Y, Li W, Yang Q, Tan L, Jia Y, Qu Y, Qian Z. Photosensitizer Micelles Together with IDO Inhibitor Enhance Cancer Photothermal Therapy and Immunotherapy. Adv Sci (Weinh). 2018; 5:1700891. https://doi.org/10.1002/advs.201700891 [PubMed]
- 9. Liu LP, Lu L, Zhao QQ, Kou QJ, Jiang ZZ, Gui R, Luo YW, Zhao QY. Identification and Validation of the Pyroptosis-Related Molecular Subtypes of Lung Adenocarcinoma by Bioinformatics and Machine Learning. Front Cell Dev Biol. 2021; 9:756340. https://doi.org/10.3389/fcell.2021.756340 [PubMed]
- 10. Tang R, Xu J, Zhang B, Liu J, Liang C, Hua J, Meng Q, Yu X, Shi S. Ferroptosis, necroptosis, and pyroptosis in anticancer immunity. J Hematol Oncol. 2020; 13:110. https://doi.org/10.1186/s13045-020-00946-7 [PubMed]
- 11. Zhang W, Zhang P, Jiang J, Peng K, Shen Z, Kang M. Development and validation of a prognostic model related to pyroptosis-related genes for esophageal squamous cell carcinoma using bioinformatics analysis. J Thorac Dis. 2022; 14:2953–69. https://doi.org/10.21037/jtd-22-948 [PubMed]
- 12. Sun L, Zhang Z, Yao Y, Li WY, Gu J. Analysis of expression differences of immune genes in non-small cell lung cancer based on TCGA and ImmPort data sets and the application of a prognostic model. Ann Transl Med. 2020; 8:550. https://doi.org/10.21037/atm.2020.04.38 [PubMed]
- 13. Liu Z, Liu J, Li Z. Chemoimmunotherapy in advanced esophageal squamous cell carcinoma: optimizing chemotherapy regimens for immunotherapy combinations. Signal Transduct Target Ther. 2022; 7:233. https://doi.org/10.1038/s41392-022-01077-w [PubMed]
- 14. Bergsbaken T, Fink SL, Cookson BT. Pyroptosis: host cell death and inflammation. Nat Rev Microbiol. 2009; 7:99–109. https://doi.org/10.1038/nrmicro2070 [PubMed]
- 15. Yu P, Zhang X, Liu N, Tang L, Peng C, Chen X. Pyroptosis: mechanisms and diseases. Signal Transduct Target Ther. 2021; 6:128. https://doi.org/10.1038/s41392-021-00507-5 [PubMed]
- 16. Fang Y, Tian S, Pan Y, Li W, Wang Q, Tang Y, Yu T, Wu X, Shi Y, Ma P, Shu Y. Pyroptosis: A new frontier in cancer. Biomed Pharmacother. 2020; 121:109595. https://doi.org/10.1016/j.biopha.2019.109595 [PubMed]
- 17. Wang Y, Gao W, Shi X, Ding J, Liu W, He H, Wang K, Shao F. Chemotherapy drugs induce pyroptosis through caspase-3 cleavage of a gasdermin. Nature. 2017; 547:99–103. https://doi.org/10.1038/nature22393 [PubMed]
- 18. Hou J, Zhao R, Xia W, Chang CW, You Y, Hsu JM, Nie L, Chen Y, Wang YC, Liu C, Wang WJ, Wu Y, Ke B, et al. PD-L1-mediated gasdermin C expression switches apoptosis to pyroptosis in cancer cells and facilitates tumour necrosis. Nat Cell Biol. 2020; 22:1264–75. https://doi.org/10.1038/s41556-020-0575-z [PubMed]
- 19. Jiang M, Wu Y, Qi L, Li L, Song D, Gan J, Li Y, Ling X, Song C. Dihydroartemisinin mediating PKM2-caspase-8/3-GSDME axis for pyroptosis in esophageal squamous cell carcinoma. Chem Biol Interact. 2021; 350:109704. https://doi.org/10.1016/j.cbi.2021.109704 [PubMed]
- 20. Zheng ZY, Yang PL, Li RY, Liu LX, Xu XE, Liao LD, Li X, Chu MY, Peng L, Huang QF, Heng JH, Wang SH, Wu ZY, et al. STAT3β disrupted mitochondrial electron transport chain enhances chemosensitivity by inducing pyroptosis in esophageal squamous cell carcinoma. Cancer Lett. 2021; 522:171–83. https://doi.org/10.1016/j.canlet.2021.09.035 [PubMed]
- 21. Li L, Song D, Qi L, Jiang M, Wu Y, Gan J, Cao K, Li Y, Bai Y, Zheng T. Photodynamic therapy induces human esophageal carcinoma cell pyroptosis by targeting the PKM2/caspase-8/caspase-3/GSDME axis. Cancer Lett. 2021; 520:143–59. https://doi.org/10.1016/j.canlet.2021.07.014 [PubMed]
- 22. Wu M, Wang Y, Yang D, Gong Y, Rao F, Liu R, Danna Y, Li J, Fan J, Chen J, Zhang W, Zhan Q. A PLK1 kinase inhibitor enhances the chemosensitivity of cisplatin by inducing pyroptosis in oesophageal squamous cell carcinoma. EBioMedicine. 2019; 41:244–55. https://doi.org/10.1016/j.ebiom.2019.02.012 [PubMed]
- 23. Wang L, Li K, Lin X, Yao Z, Wang S, Xiong X, Ning Z, Wang J, Xu X, Jiang Y, Liu D, Chen Y, Zhang D, Zhang H. Metformin induces human esophageal carcinoma cell pyroptosis by targeting the miR-497/PELP1 axis. Cancer Lett. 2019; 450:22–31. https://doi.org/10.1016/j.canlet.2019.02.014 [PubMed]
- 24. Gong W, Xu J, Wang Y, Min Q, Chen X, Zhang W, Chen J, Zhan Q. Nuclear genome-derived circular RNA circPUM1 localizes in mitochondria and regulates oxidative phosphorylation in esophageal squamous cell carcinoma. Signal Transduct Target Ther. 2022; 7:40. https://doi.org/10.1038/s41392-021-00865-0 [PubMed]
- 25. Pereira C, Gimenez-Xavier P, Pros E, Pajares MJ, Moro M, Gomez A, Navarro A, Condom E, Moran S, Gomez-Lopez G, Graña O, Rubio-Camarillo M, Martinez-Martí A, et al. Genomic Profiling of Patient-Derived Xenografts for Lung Cancer Identifies B2M Inactivation Impairing Immunorecognition. Clin Cancer Res. 2017; 23:3203–13. https://doi.org/10.1158/1078-0432.CCR-16-1946 [PubMed]
- 26. Janikovits J, Müller M, Krzykalla J, Körner S, Echterdiek F, Lahrmann B, Grabe N, Schneider M, Benner A, Doeberitz MVK, Kloor M. High numbers of PDCD1 (PD-1)-positive T cells and B2M mutations in microsatellite-unstable colorectal cancer. Oncoimmunology. 2017; 7:e1390640. https://doi.org/10.1080/2162402X.2017.1390640 [PubMed]
- 27. Yang H, Che D, Gu Y, Cao D. Prognostic and immune-related value of complement C1Q (C1QA, C1QB, and C1QC) in skin cutaneous melanoma. Front Genet. 2022; 13:940306. https://doi.org/10.3389/fgene.2022.940306 [PubMed]
- 28. Zheng Y, Zhou W, Li M, Xu R, Zhang S, Liu Y, Cen Y. IRF4-activated TEX41 promotes the malignant behaviors of melanoma cells by targeting miR-103a-3p/C1QB axis. BMC Cancer. 2021; 21:1339. https://doi.org/10.1186/s12885-021-09039-1 [PubMed]
- 29. Urban A, Majeranowski A, Stasiłojć G, Koszałka P, Felberg A, Taszner M, Zaucha JM, Okrój M. In Silico Designed Gain-of-Function Variants of Complement C2 Support Cytocidal Activity of Anticancer Monoclonal Antibodies. Cancers (Basel). 2022; 14:1270. https://doi.org/10.3390/cancers14051270 [PubMed]
- 30. Ando K, Hamada K, Shida M, Ohkuma R, Kubota Y, Horiike A, Matsui H, Ishiguro T, Hirasawa Y, Ariizumi H, Watanabe M, Onoue R, Tsurutani J, et al. A high number of PD-L1+ CD14+ monocytes in peripheral blood is correlated with shorter survival in patients receiving immune checkpoint inhibitors. Cancer Immunol Immunother. 2021; 70:337–48. https://doi.org/10.1007/s00262-020-02686-6 [PubMed]
- 31. Gustafson MP, Lin Y, Bleeker JS, Warad D, Tollefson MK, Crispen PL, Bulur PA, Harrington SM, Laborde RR, Gastineau DA, Leibovich BC, Cheville JC, Kwon ED, Dietz AB. Intratumoral CD14+ Cells and Circulating CD14+HLA-DRlo/neg Monocytes Correlate with Decreased Survival in Patients with Clear Cell Renal Cell Carcinoma. Clin Cancer Res. 2015; 21:4224–33. https://doi.org/10.1158/1078-0432.CCR-15-0260 [PubMed]
- 32. Cheah MT, Chen JY, Sahoo D, Contreras-Trujillo H, Volkmer AK, Scheeren FA, Volkmer JP, Weissman IL. CD14-expressing cancer cells establish the inflammatory and proliferative tumor microenvironment in bladder cancer. Proc Natl Acad Sci U S A. 2015; 112:4725–30. https://doi.org/10.1073/pnas.1424795112 [PubMed]
- 33. Yang R, Chen Z, Liang L, Ao S, Zhang J, Chang Z, Wang Z, Zhou Y, Duan X, Deng T. Fc Fragment of IgE Receptor Ig (FCER1G) acts as a key gene involved in cancer immune infiltration and tumour microenvironment. Immunology. 2023; 168:302–19. https://doi.org/10.1111/imm.13557 [PubMed]
- 34. Li L, Huang Z, Du K, Liu X, Li C, Wang D, Zhang Y, Wang C, Li J. Integrative Pan-Cancer Analysis Confirmed that FCGR3A is a Candidate Biomarker Associated With Tumor Immunity. Front Pharmacol. 2022; 13:900699. https://doi.org/10.3389/fphar.2022.900699 [PubMed]
- 35. George B, Pillai PM, Paul AM, Amjesh R, Leitzel K, Ali SM, Sandiford O, Lipton A, Rameshwar P, Hortobagyi GN, Pillai MR, Kumar R. Cellular Fitness Phenotypes of Cancer Target Genes from Oncobiology to Cancer Therapeutics. Cells. 2021; 10:433. https://doi.org/10.3390/cells10020433 [PubMed]
- 36. Lebraud E, Eloudzeri M, Rabant M, Lamarthée B, Anglicheau D. Microvascular Inflammation of the Renal Allograft: A Reappraisal of the Underlying Mechanisms. Front Immunol. 2022; 13:864730. https://doi.org/10.3389/fimmu.2022.864730 [PubMed]
- 37. Li Y, Qi J, Yang J. RTP4 is a novel prognosis-related hub gene in cutaneous melanoma. Hereditas. 2021; 158:22. https://doi.org/10.1186/s41065-021-00183-z [PubMed]
- 38. Fan S, Zhao Y, Li X, Du Y, Wang J, Song X, Zhou F, Chen H, Chen G, Zhao Y, Mao Y, Lan Q. Genetic variants in SLC7A7 are associated with risk of glioma in a Chinese population. Exp Biol Med (Maywood). 2013; 238:1075–81. https://doi.org/10.1177/1535370213498977 [PubMed]