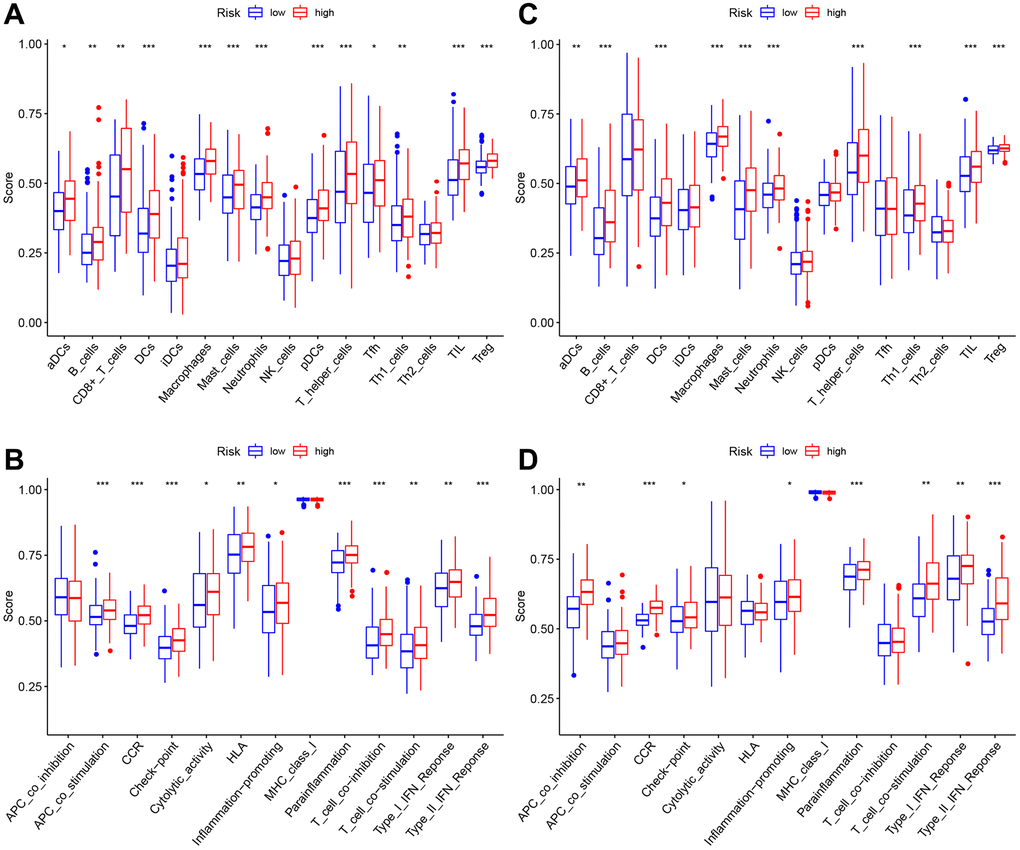
Figure 7.The immune landscape of two pyroptosis-related molecular subtypes. (A, B) Comparison of the enrichment scores of 16 types of immune cells and 13 immune-related functions between low- (blue box) and high-risk (red box) groups in the TCGA cohort, (C, D) Comparison of the enrichment scores of 16 types of immune cells and 13 immune-related functions between low- (blue box) and high-risk (red box) groups in the GEO cohort. Adjusted P-values were shown as ns (not significant); *P < 0.05; **P < 0.01; ***P < 0.001.