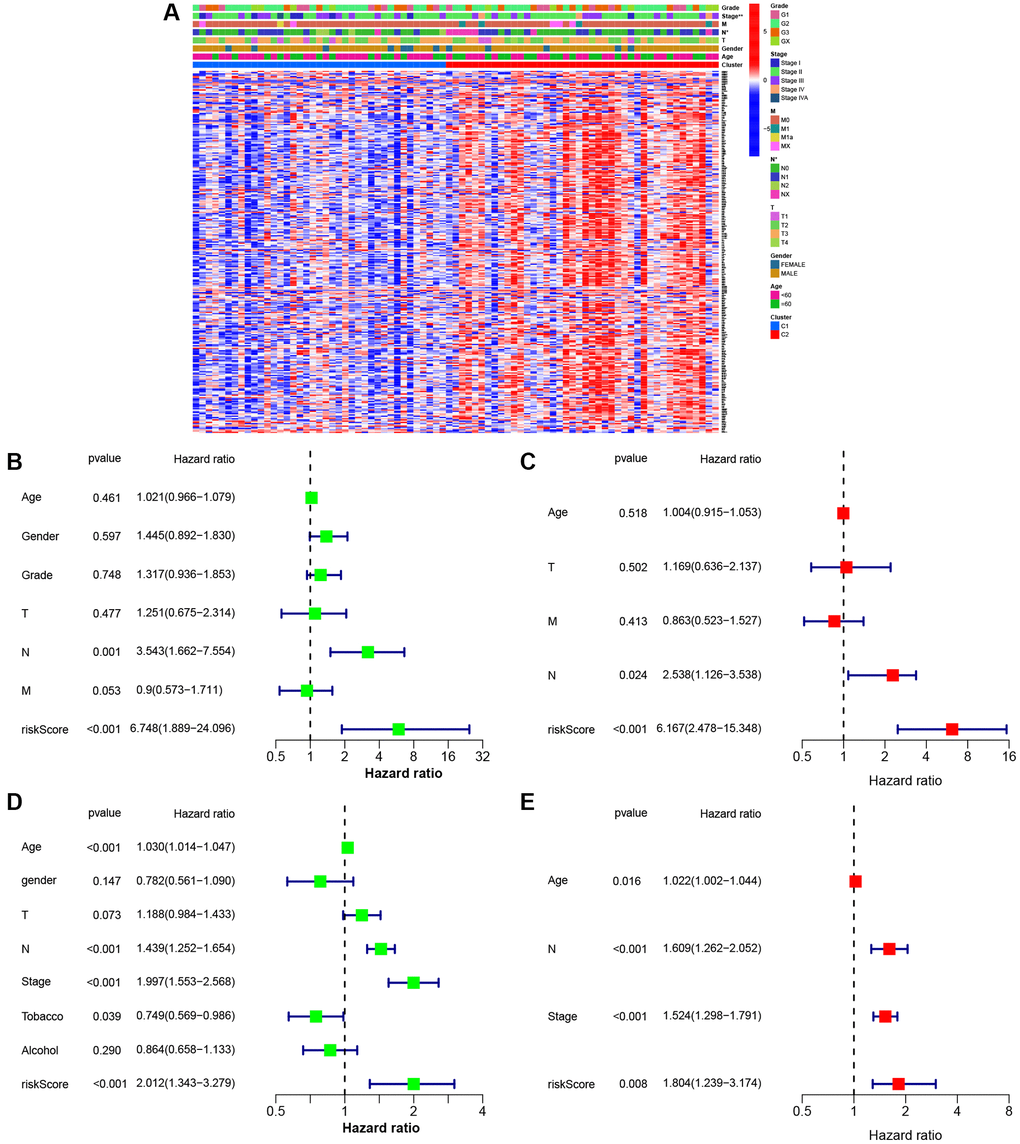
Figure 5.Univariate and multivariate Cox regression analyses for the risk score. (A) Heatmap (blue: low expression; red: high expression) for the connections between clinicopathological features and the risk groups (*P < 0.05). (B) Univariable Cox regression analysis for the risk score in TCGA. (C) Multivariable Cox regression analysis for the risk score in TCGA. (D) Univariable Cox regression analysis for the risk score in GEO. (E) Multivariable Cox regression analysis for the risk score in GEO.