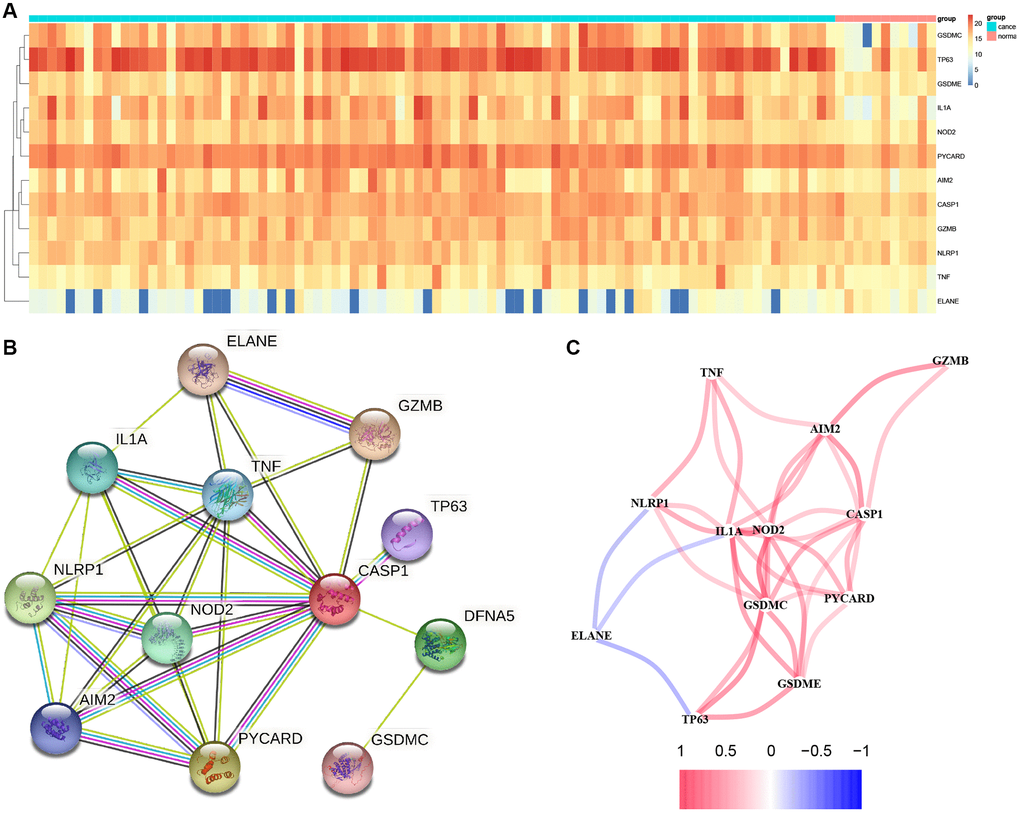
Figure 1.Results of differential gene analysis. (A) Heatmap of differentially expressed pyroptosis-related genes. The vertical axis refers to genes; the horizontal axis refers to differences in the gene expression between tissues, the red denotes high expression, and the blue denotes low expression. (B) PPI network showing the interactions of differentially expressed pyroptosis-related genes. (C) Correlation of the differentially expressed pyroptosis-related genes (Red line: Positive correlation; Blue line: Negative correlation. The depth of the colors reflects the strength of the relevance).