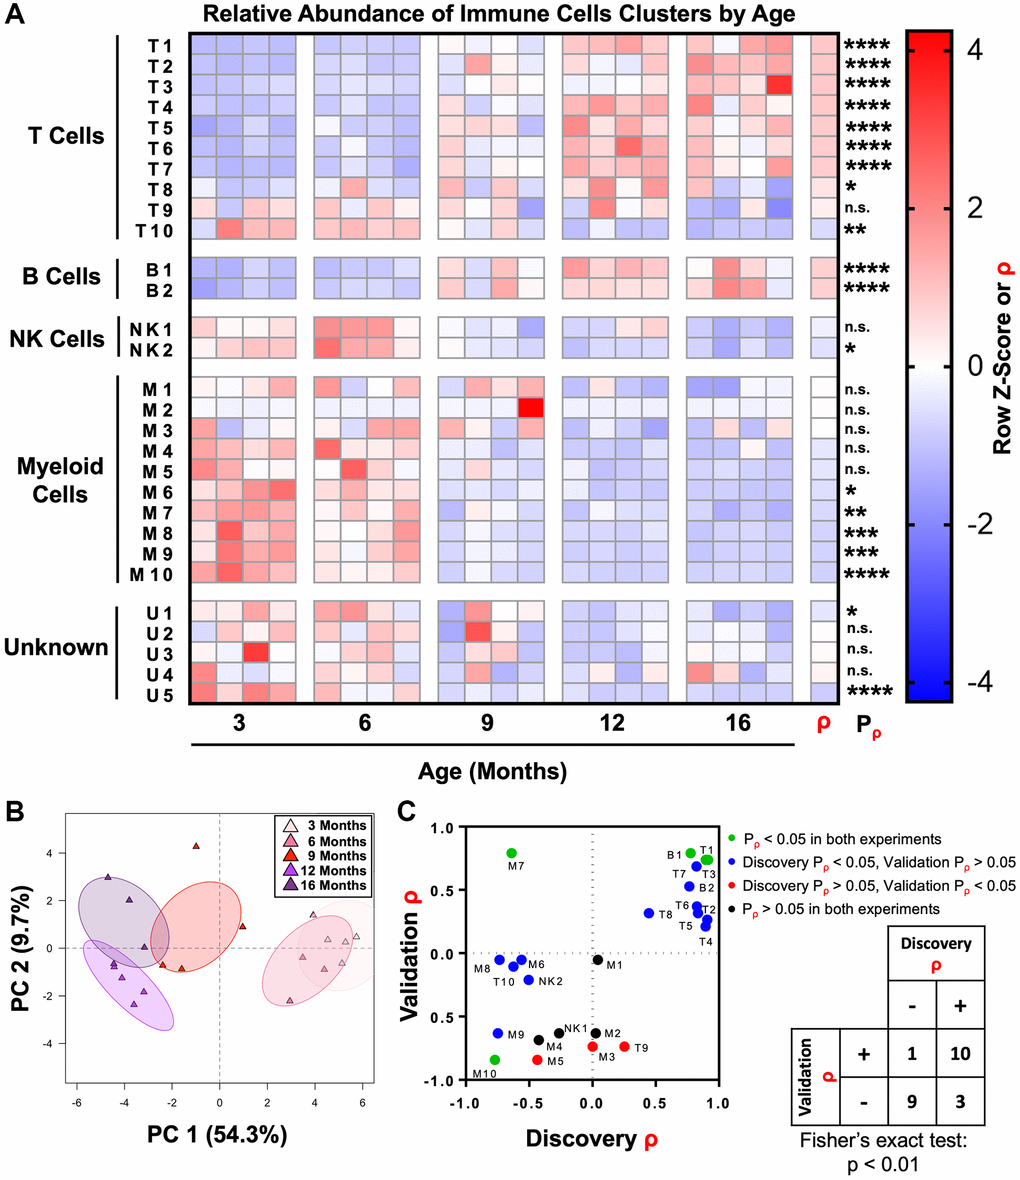
Figure 3.The adult mouse prostate immune microenvironment changes progressively with age. (A) Heat map showing changes to immune cell cluster abundance in the aging adult mouse prostate, correlation with age (ρ), and associated p-value (Pρ). Shading indicates abundance represented as a row z-score except where Spearman correlation (ρ) is indicated. Data represents 4 biological replicates at each age. *p < 0.05, **p < 0.01, ***p < 0.001, ****p < 0.0001. n.s., not significant, p ≥ 0.05. (B) Principal component analysis (PCA) was performed on immune cell cluster frequencies for mouse prostates at different ages. Ellipses represent 95% confidence intervals for 4 biological replicates at each age. Abbreviation: PC: principal component. (C) Twenty-four clusters of immune cells were identified in a separate validation experiment with prostates from mice 4-, 9-, and 15-months-old (each n = 3). These clusters were matched to clusters in the discovery experiment, and correlation with age (ρ) and associated p-value (Pρ) were calculated. Left: Dot plot compares correlation coefficients for each immune cell cluster in the initial (discovery) and validation experiments. Coloring of points represents significance (Pρ). Right: Contingency table comparing the direction of correlation with age (ρ > 0 or ρ < 0) irrespective of p-value for immune cell clusters between the discovery and validation experiments. Cluster M3 was not counted because ρ = 0 in the discovery experiment. Fisher’s exact test was performed to evaluate the distribution of clusters in the four quadrants of the graph/contingency table, p < 0.01.