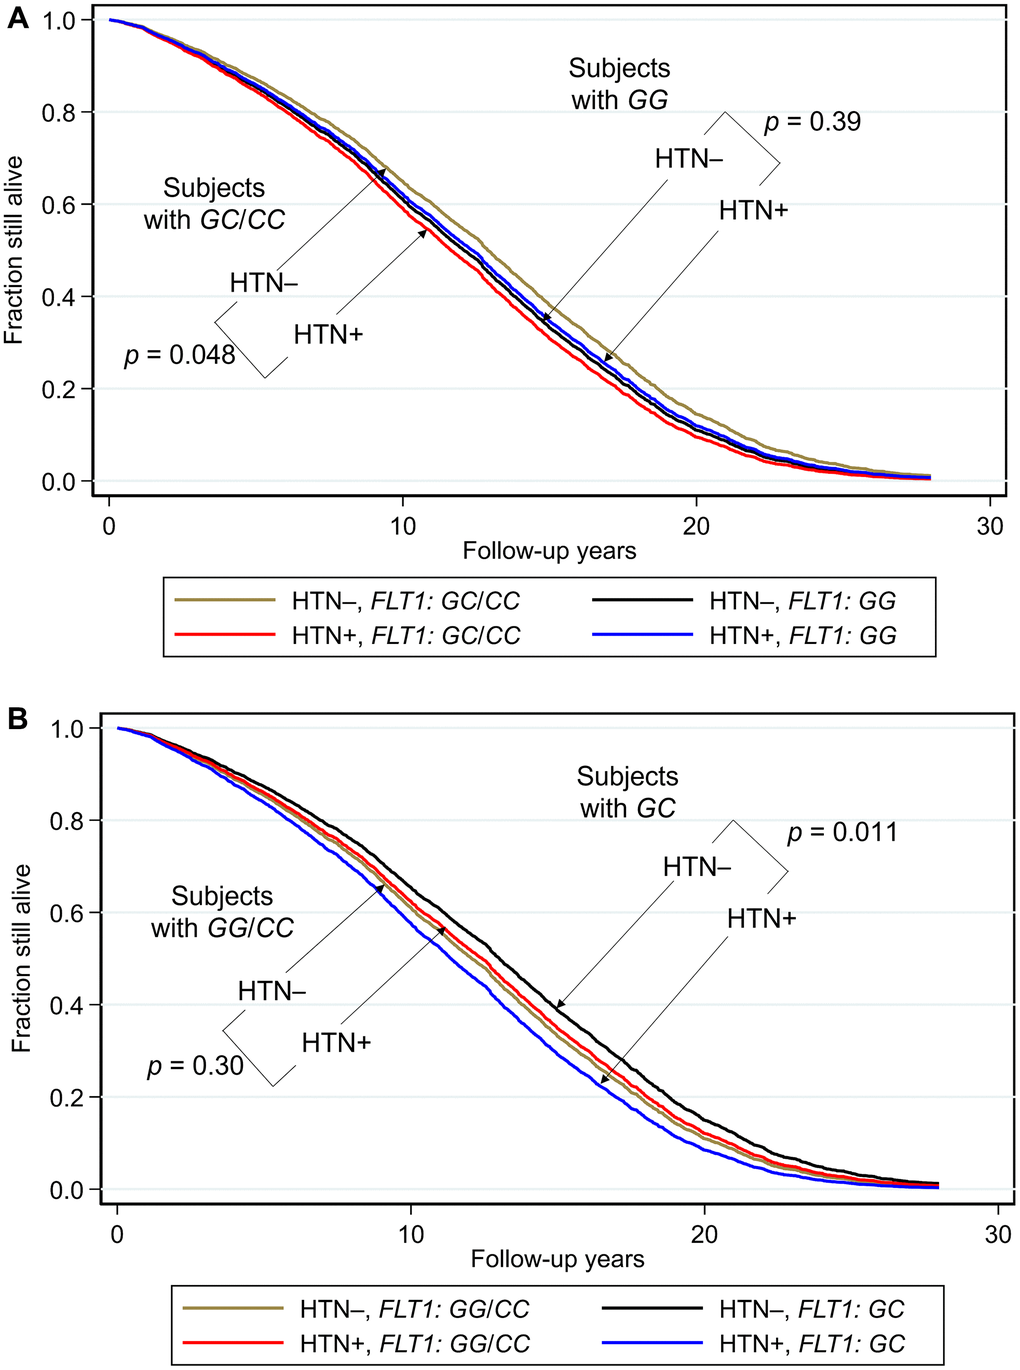
Figure 1.Survival curves spanning the period from baseline (1991–1993) to December 31, 2019 showing fraction still alive for subjects with and without hypertension according to genotypes of FLT1 SNP rs3794396. (A) Major allele recessive model, and (B) heterozygote disadvantage model, the survival probabilities were estimated from Cox proportional hazard models. In (A) Cox model was h(t) = h(t0) * exp(β1*Age + β2*BMI + β3*glucose + β4*hypertension + β5*FLT1_GG + β6* (hypertension*FLT1_ GG)), by fixing age at 75 years, BMI at the mean, 23.5 kg/m2, and glucose at the mean, 113 mg/dL (where β6 is the effect of the interaction of hypertension with FLT1 genotype on mortality for GG vs GC/CC, i.e., a major allele recessive model, giving p(β6) = 0.031). Shown are survival curves for each genotype and hypertension status for the major allele recessive model. Comparisons by genotype GC/GG for subjects who had hypertension (HTN+) vs. subjects who did not have hypertension (HTN–) showed a significant protective effect against mortality for genotypes GG/CC. In men with hypertension who had a longevity-associated genotype GC or CC, the mortality risk was reduced to a level not significantly different from subjects without hypertension. In (B) Cox model was h(t) = h(t0) * exp(β1*Age + β2*BMI + β3*glucose + β4*hypertension + β5*FLT1_GC + β6* (hypertension*FLT1_ GC)), by fixing age at 75 years, BMI at the mean, 23.5 kg/m2, and glucose at the mean, 113 mg/dL (where β6 is the effect of the interaction of hypertension with FLT1 genotype on mortality for GC vs GG/CC, i.e., a heterozygote disadvantage model, giving p(β6) = 0.0060). Shown are survival curves for each genotype and hypertension status. Comparisons by genotype GC for subjects who had hypertension (HTN+) vs. subjects who did not have hypertension (HTN–) showed a significant protective effect against mortality for genotypes GG/CC. Plotting the survival curves by hypertension status (not shown) gave a p value for hypertensive GC vs. GG/CC of 0.0065, and for normotensive GC vs. GG/CC of 0.11. In men with hypertension who had a longevity-associated genotype GG or CC, the mortality risk was reduced to a level not significantly different from subjects without hypertension (hypertensive GG/CC vs. normotensive GG/CC: p = 0.30; hypertensive GG/CC vs normotensive GC: p = 0.24).