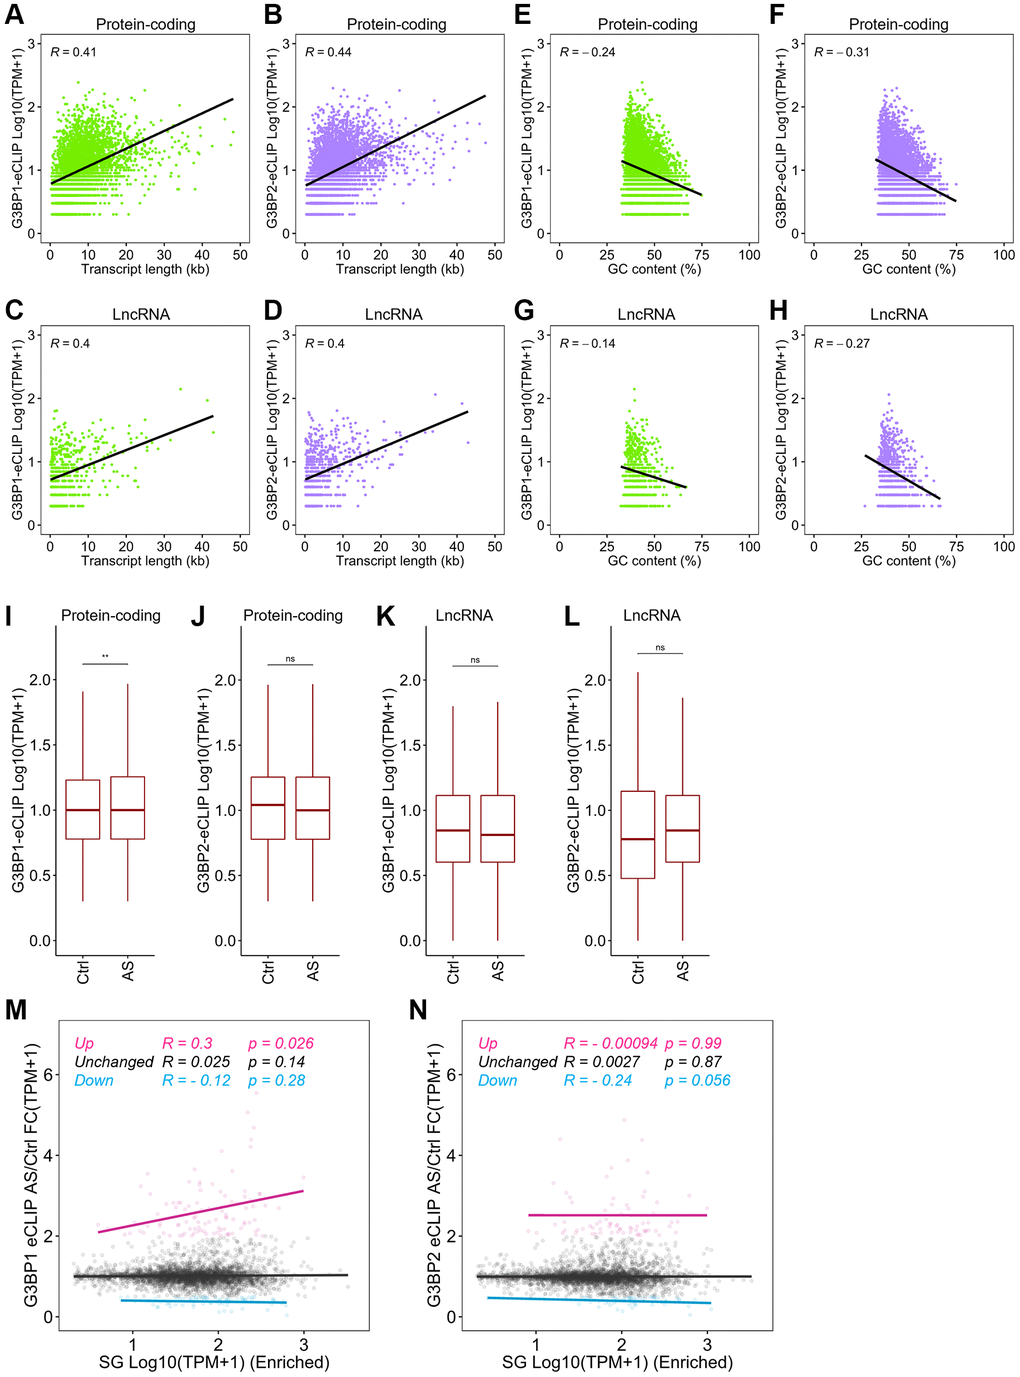
Figure 4.Distinct RNA targeting of G3BP1 and G3BP2 after stress. (A, B) Scatter plot depicting the correlation between mRNA length and the RNA binding levels of G3BP1 (A) and G3BP2 (B) with eCLIP-peaks. R indicates the Pearson correlation coefficient. (C, D) Scatter plot depicting the correlation between GC content of mRNAs and the RNA binding levels of G3BP1 (C) and G3BP2 (D) with eCLIP-peaks. (E, F) Scatter plot depicting the correlation between lncRNA length and the RNA binding levels of G3BP1 (E) and G3BP2 (F) with eCLIP-peaks. (G, H) Scatter plot depicting the correlation between GC content of lncRNAs and the RNA binding levels of G3BP1 (G) and G3BP2 (H) with eCLIP-peaks. (I–L) Boxplots depicting the G3BP1- and G3BP2-bound mRNA and lncRNA levels of SG-enriched RNAs before and after AS treatment. Statistical significance was computed with Wilcoxon rank sum test. ns: not significant, **p < 0.01. (M, N) Scatter plot showing the correlation between SG enriched RNA levels and change in G3BP1- and G3BP2-bound RNA levels upon AS treatment. R and p indicate Pearson correlation coefficient and p-value, respectively.