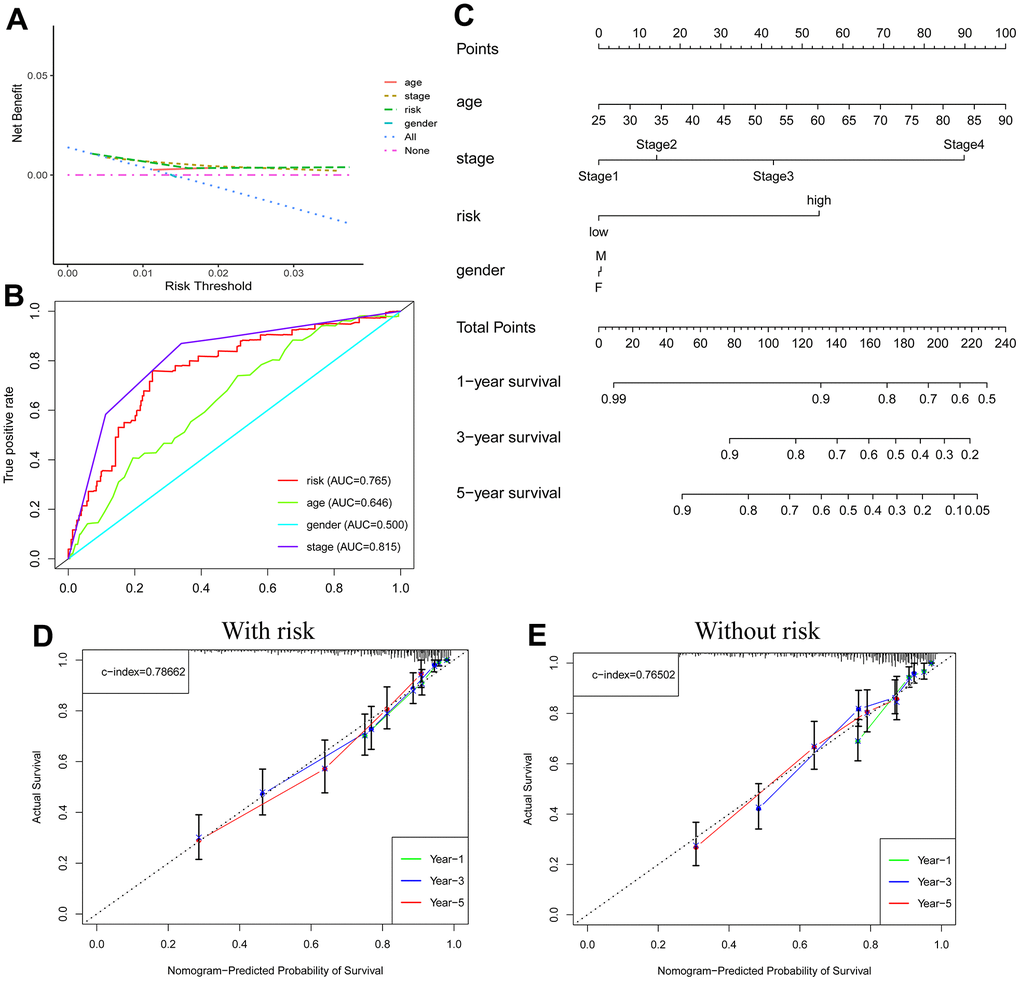
Figure 6.Nomogram predicts patient prognosis. Decision curve to test for forecast value (A); ROC curves containing different clinical information (B); A clinical prognosis nomogram is constructed by age, gender, risk, and stage together (C). Nomogram with (D) and without (E) risk model.