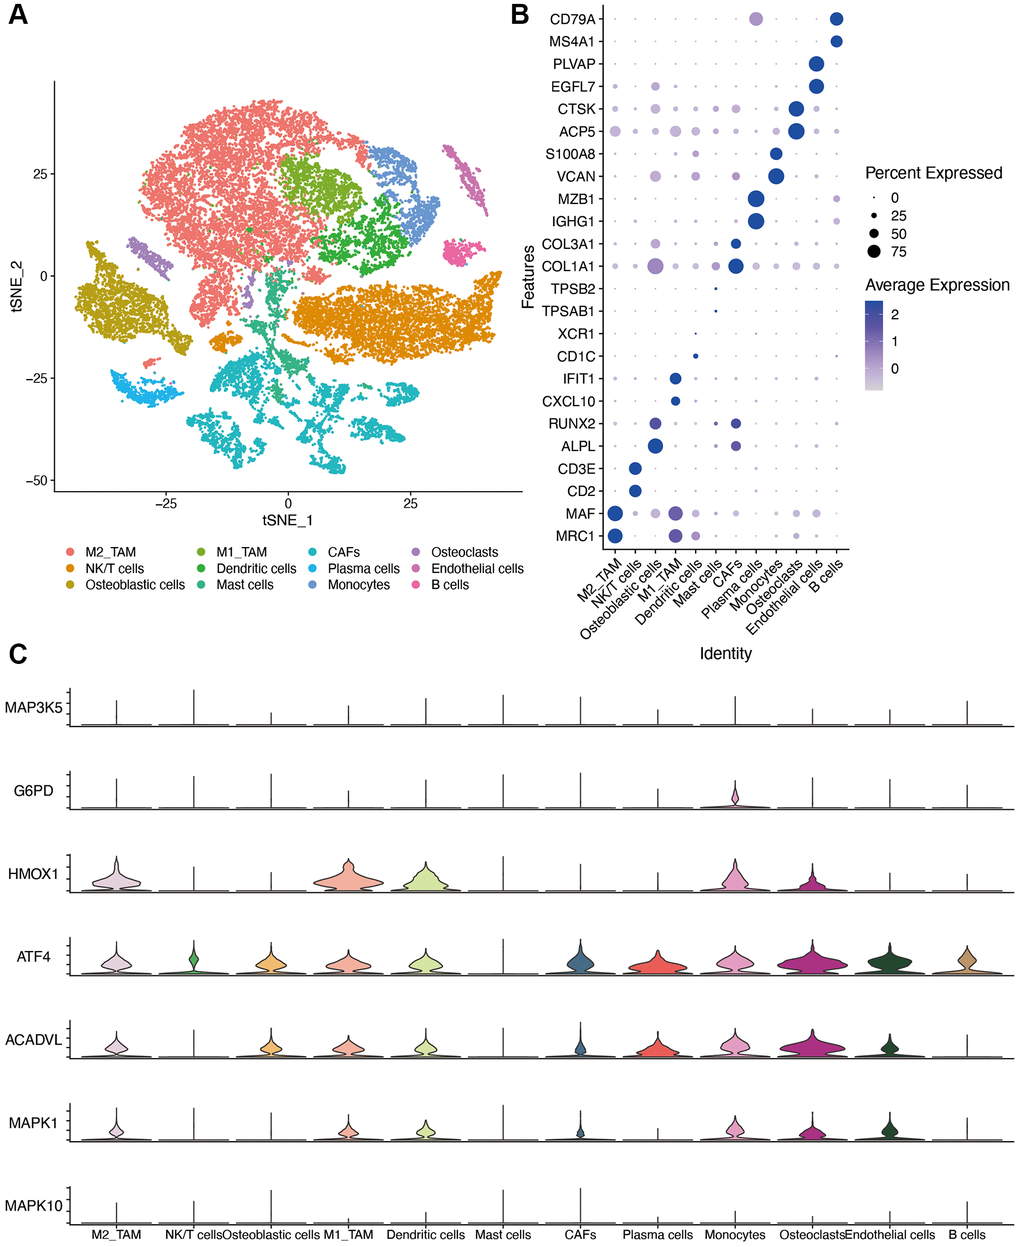
Figure 10.Single-cell sequencing dataset analysis. (A) The TSNE plot of 12 cell clusters of GSE162454. (B) Dot plot showing the expression levels of marker gene in single cell sequencing data. (C) violin plot of OS-related genes in different cell types. Abbreviations: CAF: cancer associated fibroblasts; TAM: tumor associated macrophages.