


Introduction
Osteosarcoma is the most prevalent bone malignancy among adolescents, with a high incidence rate of 8–11/1,000,000/year in the 15–19 years age group [1, 2]. It primarily affects the long bones, including the femur, tibia, and humerus [3]. The second peak of osteosarcoma occurrence is after the age of 50 years [4]. Most patients with osteosarcoma have lung metastases when first diagnosed, and their 5-year survival rate is less than 20% [5]. However, the 5-year survival rate of osteosarcoma patients without lung metastases is almost 70% [6]. Despite treatment options such as surgery and chemotherapy, the 5-year survival rates are overall dismal because of the genetic complexity and instability of these tumors [7, 8]. High-throughput technologies have been used in recent oxidative stress (OS) studies, which have revealed differentially expressed genes (DEGs) such as COL1A2 and matrix metalloproteases (MMPs) between osteosarcoma and normal samples [9, 10]. These sequence data provide a method for early diagnosis and treatment, as well as enable accurate prognosis to improve the outcomes of osteosarcoma patients.
OS is characterized by excessive production of reactive oxygen species (ROS) that cannot be effectively quenched by the cellular antioxidative mechanisms [11, 12]. OS is the underlying pathological basis of degenerative diseases, such as Alzheimer’s disease [13], diabetes [14], and arthritis [15], and cancers, including bladder cancer [16] and breast cancer [17]. Cancer cells are characterized by increased aerobic glycolysis and high levels of ROS [18]. While the high metabolic rates promote cellular migration, survival, and proliferation, ROS-induced oxidative DNA damage initiates oncogenic transformation and subsequent tumor progression. Given the metabolic and signaling aberrations caused by increased ROS levels, the pathways involved in ROS production are promising therapeutic targets for cancer [19]. An increase in oxidative stress and decrease in antioxidant status is observed in primary bone sarcomas [20]. Several studies have also revealed the anti-cancer potential of differential ROS production pathways for treating osteosarcoma in vitro and in vivo [21–23].
The human immune system has evolved to eradicate pathogens and tumor cells [24], mainly through effector cells such as basophils, macrophages, neutrophils, eosinophils, and natural killer (NK) cells [25]. In contrast, the humoral immune system is less involved in anti-tumor responses, and may even promote tumor growth under certain conditions. The tumor microenvironment (TME) is a complex network of tumor cells, stromal cells, and immune cells. The non-tumor cell populations also have diverse and complex regulatory effects on tumor progression. For instance, an abundance of cancer-associated fibroblasts (CAFs) in the TME is conducive to tumor growth [26], whereas high levels of tumor-associated macrophages (TAMs) are associated with lower metastasis and improved survival in osteosarcoma [27]. Therefore, the role of TME in osteosarcoma prognosis warrants further investigation.
To this end, we retrieved the clinical and transcriptomic data of osteosarcoma patients from the Therapeutically Applicable Research to Generate Effective Treatments (TARGET) database. The OS-related genes were screened using univariate Cox regression, and a prognostic model was constructed following LASSO and multivariable Cox regression analyses. The accuracy and generalizability of the risk model was validated in an external cohort. The correlation between the risk score and TME was evaluated, and a predictive nomogram was constructed by combining the clinical characteristics and risk score. The flow chart of the study is shown in Figure 1.
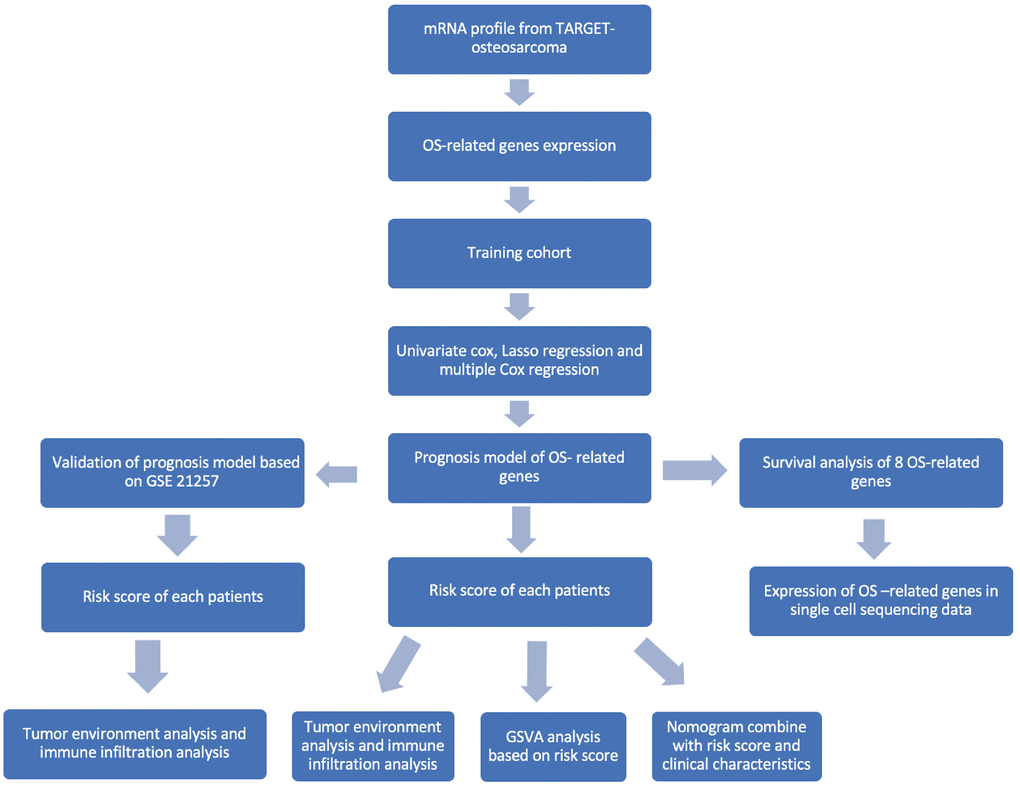
Figure 1. Flowchart of this study.
Materials and Methods
Data sources
The mRNA sequencing data and clinical information 86 osteosarcoma patients were retrieved from the TARGET database (https://ocg.cancer.gov/programs/target) to construct an OS-related risk model. A total of 817 OS-related genes were obtained from GeneCards database (https://www.genecards.org/). In addition, the GSE21257 and GSE39055 datasets including 90 osteosarcoma samples was downloaded from the GEO database (https://www.ncbi.nlm.nih.gov/geo/) to validate the risk model. Normalization of fragments per kilobase of exon model per million mapped fragments (FPKM) was performed in the TARGET-OS dataset and Limma package was used to normalize gene expression [28]. The R package sva was used to eliminate batch effect of different databases [29]. The clinical data of patients in the TARGET-OS and validation cohorts are summarized in Table 1. The GSE162454 dataset containing the single-cell sequencing data of six osteosarcoma samples was also retrieved from the GEO database [30].
Table 1. Clinical information of training and validation cohorts.
| TARGET-OS | GSE21257 | GSE39055 | |
| Samples | 86 | 52 | 38 |
| Age | 14.5 | 16.7 | 13.5 |
| Female percent | 43.0% | 36.5% | 44.8% |
| Metastasis percent | 25.6% | 64.1% | Na |
| Survival time | 4.11 | 5.71 | 4.41 |
Gene set enrichment analysis
The DEGs between the high- and low-risk groups in the TARGET cohort were screened using the Limma package. The significantly enriched gene ontology pathways, namely biological processes (BPs), cellular components (CCs), and molecular functions (MFs), associated with DEGs were identified by gene set variation analysis (GSVA) packages in R software with |log2FC|>1 and adj. P value < 0.05 as thresholds [34].
Construction of a predictive nomogram based on the risk model
The prognostic model was integrated with the clinical characteristics including gender, race, metastasis, and risk score to build a nomogram using the Survminer package in R. The predictive accuracy of the nomogram was validated by C-index and comparison of the fitting degree between the observed and optimized values was performed.
Immunohistochemistry and hematoxylin-eosin staining
OS-related genes were experimentally verified by immunohistochemistry (IHC). Three osteosarcoma tissues and peri-tumor tissues were collected from patients at First Affiliated Hospital of China Medical University. A consent form was signed by each participant. The present study was approved by the ethics committee of the hospital with the registration number 2019-285-2.
Hematoxylin-eosin (HE) staining was performed to identify histology type of tissues. Tissues were fixed and paraffinized before IHC staining. Antigens were retrieved using citrate antigen retrieval buffer. Endogenous peroxidase was blocked by 3% hydrogen peroxide solution, incubated at room temperature for 25 min in the dark. In the histochemical area, 3% BSA (Bovine Serum Albumin, Servicebio) was added dropwise to cover the tissue evenly, and it was sealed at room temperature for 30 min. Sections were incubated overnight at 4°C in a humidified chamber with corresponding antibodies. Antibody applications were as follows: ACADVL (Proteintech, 1:200), ATF4 (Servicebio, 1:2000), HMOX1 (Servicebio, 1:500), MAPK10 (Servicebio, 1:200), INS (Servicebio, 1:200). Secondary antibody (HRP-labeled) corresponding to the primary antibody was added to cover the tissue area and slides were incubated at room temperature for 50 minutes. Freshly prepared DAB (3,3′-Diaminobenzidine) chromogenic were used for color development in the IHC area. Nuclei were counterstained with hematoxylin for about 3 min. Finally, microscopic examination and image acquisition analysis were performed.
Statistical analysis
Statistical analyses were performed using the R software (Version 4.1.3). Two-tailed Student’s t-test and Wilcox test were performed to compare gene expression or scores between two independent groups. Kaplan–Meier survival analysis, LASSO regression analysis, and multivariable Cox regression analysis were performed to identify prognostic genes. Forest plots of nomogram were visualized using forest algorithm. P value < 0.05 was considered statistically significant.
Availability of data and materials
The source data and R code of the manuscript was uploaded in OSF (https://doi.org/10.17605/OSF.IO/238HP).
Results
Construction of an OS-related prognostic model
A multivariable Cox regression model was constructed, and eight prognostic OS-related genes were obtained using the stepwise regression function (Table 2). The risk score of each patient was calculated, and the patients were stratified into high-risk and low-risk groups depending on the median score. The patients in the low-risk group showed better overall survival compared with those in the high-risk group (Figure 2A, p < 0001). The time-dependent ROC curve was then plotted to evaluate the predictive efficiency of the prognostic model. The areas under curve (AUCs) for 1-, 3-, and 5-year survival were 0.89, 0.91, and 0.91, respectively (Figure 2B), suggesting that the model can accurately predict the overall survival of osteosarcoma patients. The risk score distribution of patients in the high- and low-risk groups is shown in Figure 2C and 2D, and the expression levels of OS-related genes in each patient are shown in the form of a heatmap in Figure 2E. We calculated the risk score in different subgroups, and did not observe any significant effect of gender or the site of osteosarcoma on risk scores (Figure 2F and 2G). However, patients with metastasis had a higher risk score than those without metastasis (p = 0.036, Figure 2H).
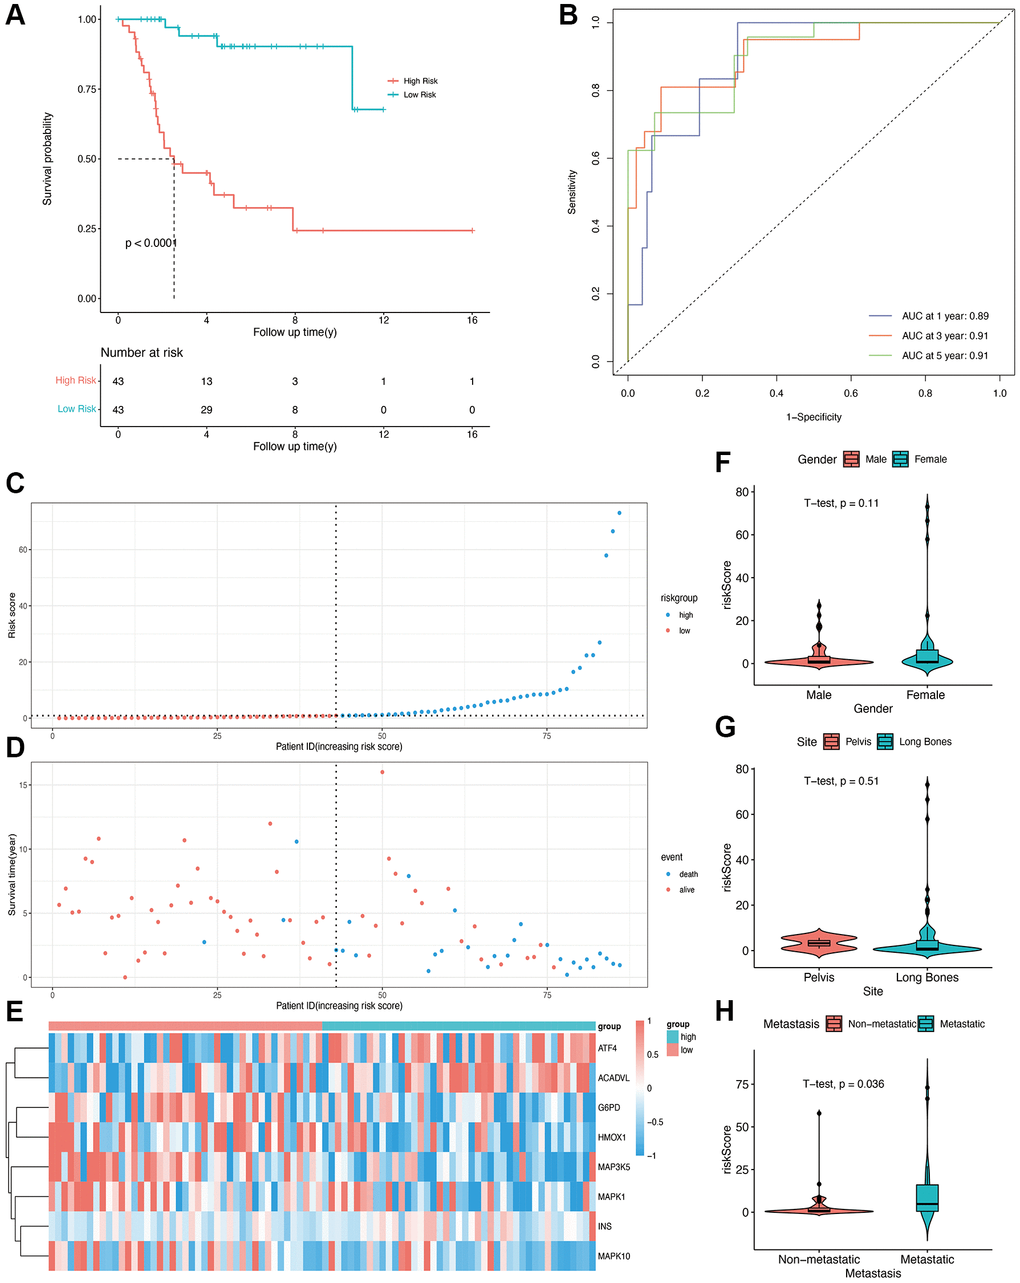
Figure 2. Construction of OS-related prognostic model for osteosarcoma in the TARGET cohort. (A) Kaplan-Meier curves showing the overall survival in the high-risk and low-risk groups (p < 0.0001). (B) AUCs for 1-, 3-, and 5-year survival according to the ROC curves. (C) The risk score curve of each patient. (D) The distribution of survival status. (E) The heatmap of eight OS-related genes between the high- and low-risk groups. (F, G, H) Risk scores in the gender, site, and metastasis subgroups.
Validation of prognostic model
To validate the predictive ability of the OS-related prognostic model, the independent dataset GSE21257 and GSE39055 were used for the validation of our risk model. The patients in the validation cohort were also grouped into the high- and low-risk groups based on the median score in the training cohort. As shown in Figure 3A, and 3B, compared with low-risk group, the high-risk group had lower survival time. The K-M plot of validation group was shown in Figure 3, there was significant difference in high and low risk group (p = 0.007). The areas under the curve for prediction of 1-, 3-, and 5-years survival of patients were 0.63, 0.66 and 0.65, respectively (Figure 3D).
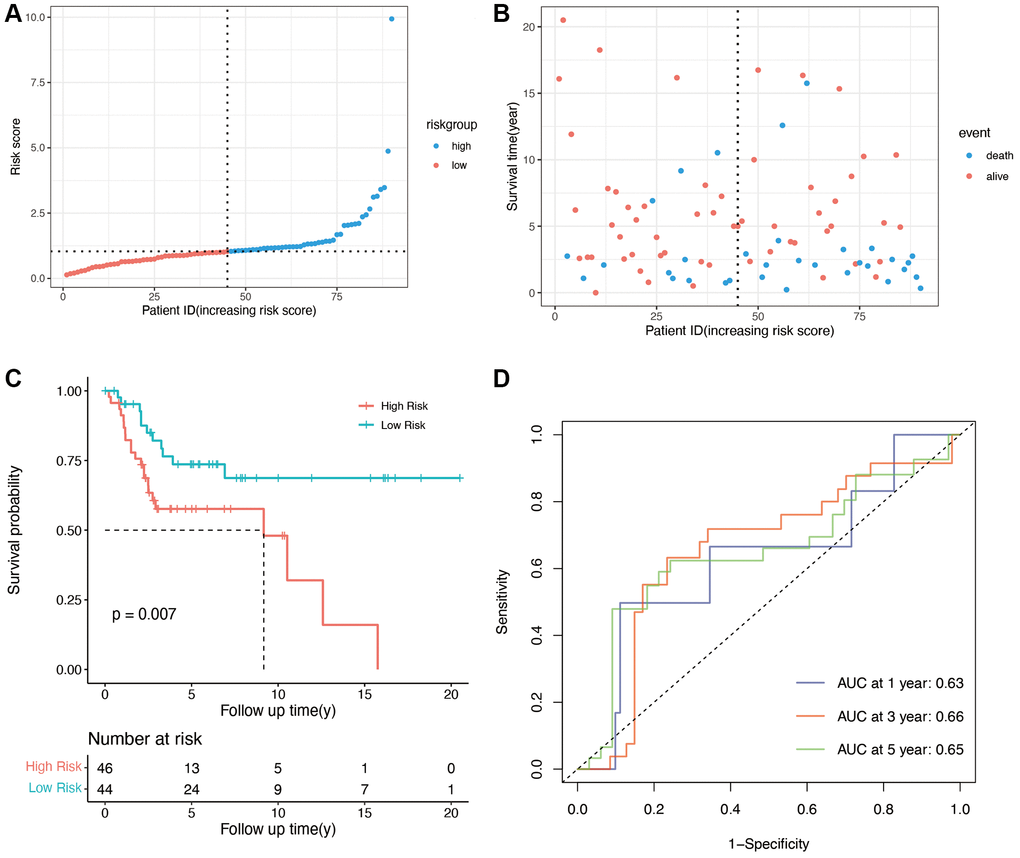
Figure 3. Validation of OS-related genes in the GSE21257 and GSE39055 cohort. (A) Validation group was divided into high- and low-risk groups using the median risk score as the cutoff value. (B) the relationship between risk score and survival time and status of patients. (C) K-M plot of high and low risk groups in validation group (p = 0.007). (D) AUCs for 1-, 3-, and 5-year survival according to ROC curves.
Survival analysis and functional enrichment of the prognostic OS genes
Based on the expression level of each gene in the prognostic model, the patients were divided into high- and low-expression groups. The survival curves corresponding to the genes are shown in Figure 4A–4H. Low expression levels of ACADVL (p = 0.028), ATF4 (p = 0.00047), and INS (p = 0.027) were associated with improved survival, whereas high expression of HMOX1 (p = 0.0033) and MAPK10 (p = 0.036) showed better prognosis. To further explore the underlying molecular mechanisms of the prognostic model, we identified 106 differentially enriched GO terms between the high- and low-risk groups in the TARGET database with |log2FC|>1 and adj. p value < 0.05 as the cut-offs. The top 50 enriched GO terms obtained from GSVA are shown in Figure 4I, and these included many immune-related terms such as immune response, positive and negative regulation of T cells, and leukocyte-mediated cytotoxicity. This suggested that the OS-related prognostic genes have an impact on TME and immune infiltration in osteosarcoma.
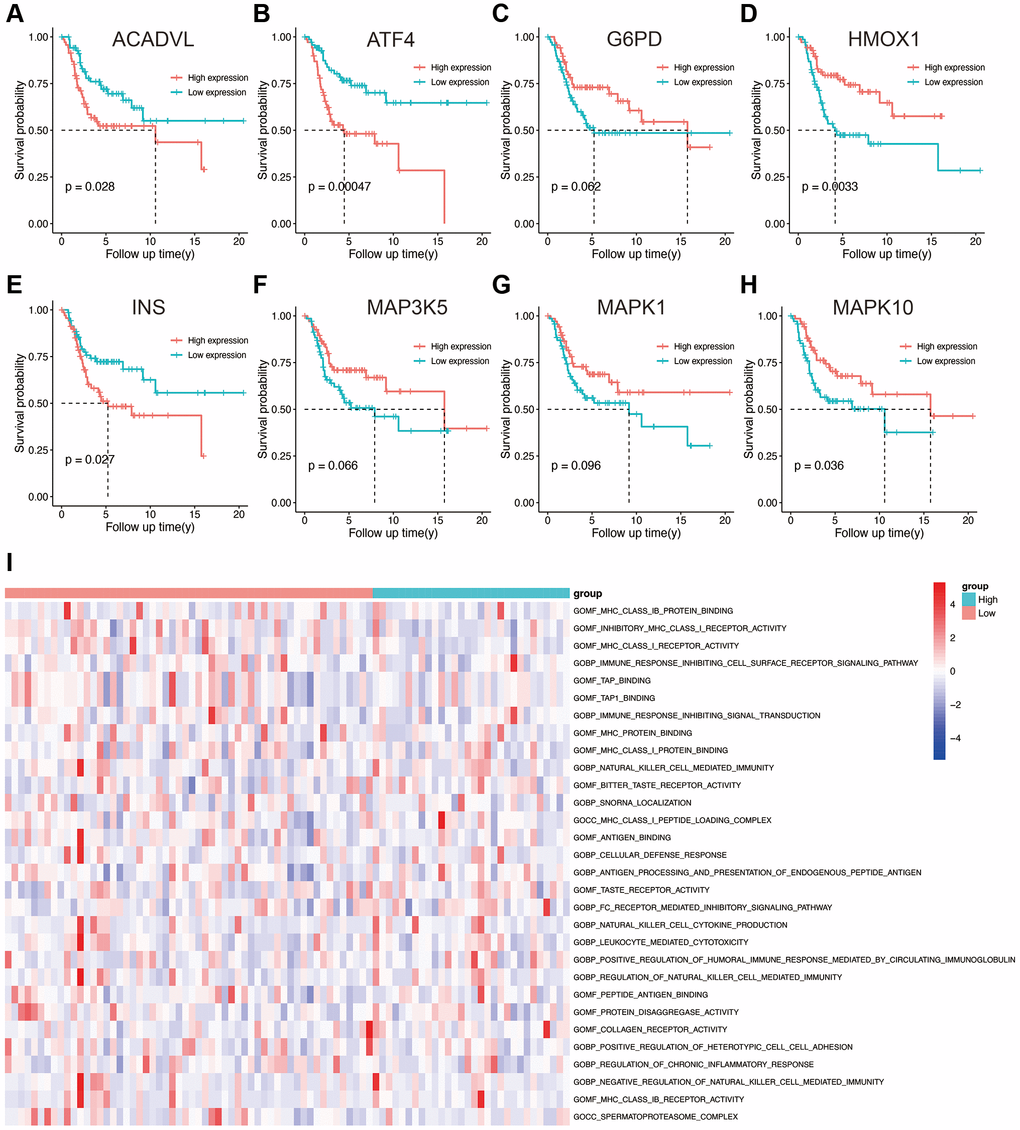
Figure 4. (A–H) Kaplan-Meier survival analysis of eight OS-related genes. (I) Results of GSVA in the high- and low-risk groups. Abbreviations: GO: gene ontology; BP: biological process; CC: cellular components; MF: molecular functions.
TARGET database with |log2FC|>1 and adj.p value < 0.05 as the cut-offs. The top 50 enriched GO terms obtained from GSVA are shown in Figure 4I, and these included many immune-related terms such as immune response, positive and negative regulation of T cells, and leukocyte-mediated cytotoxicity. This suggested that the OS-related prognostic genes have an impact on TME and immune infiltration in osteosarcoma.
Validation of survival signatures of OS-related genes
We performed IHC among OS-related genes with significantly difference using corresponding antibodies. The IHC results illustrated that the expression of AVADVL, ATF4, INS and MAPK10 was higher in osteosarcoma tissues compared to normal tissues (Figure 5). However, the expression of HMOX1 was lower in osteosarcoma tissues, which was in line with the prediction of Kaplan-Meier survival curve.
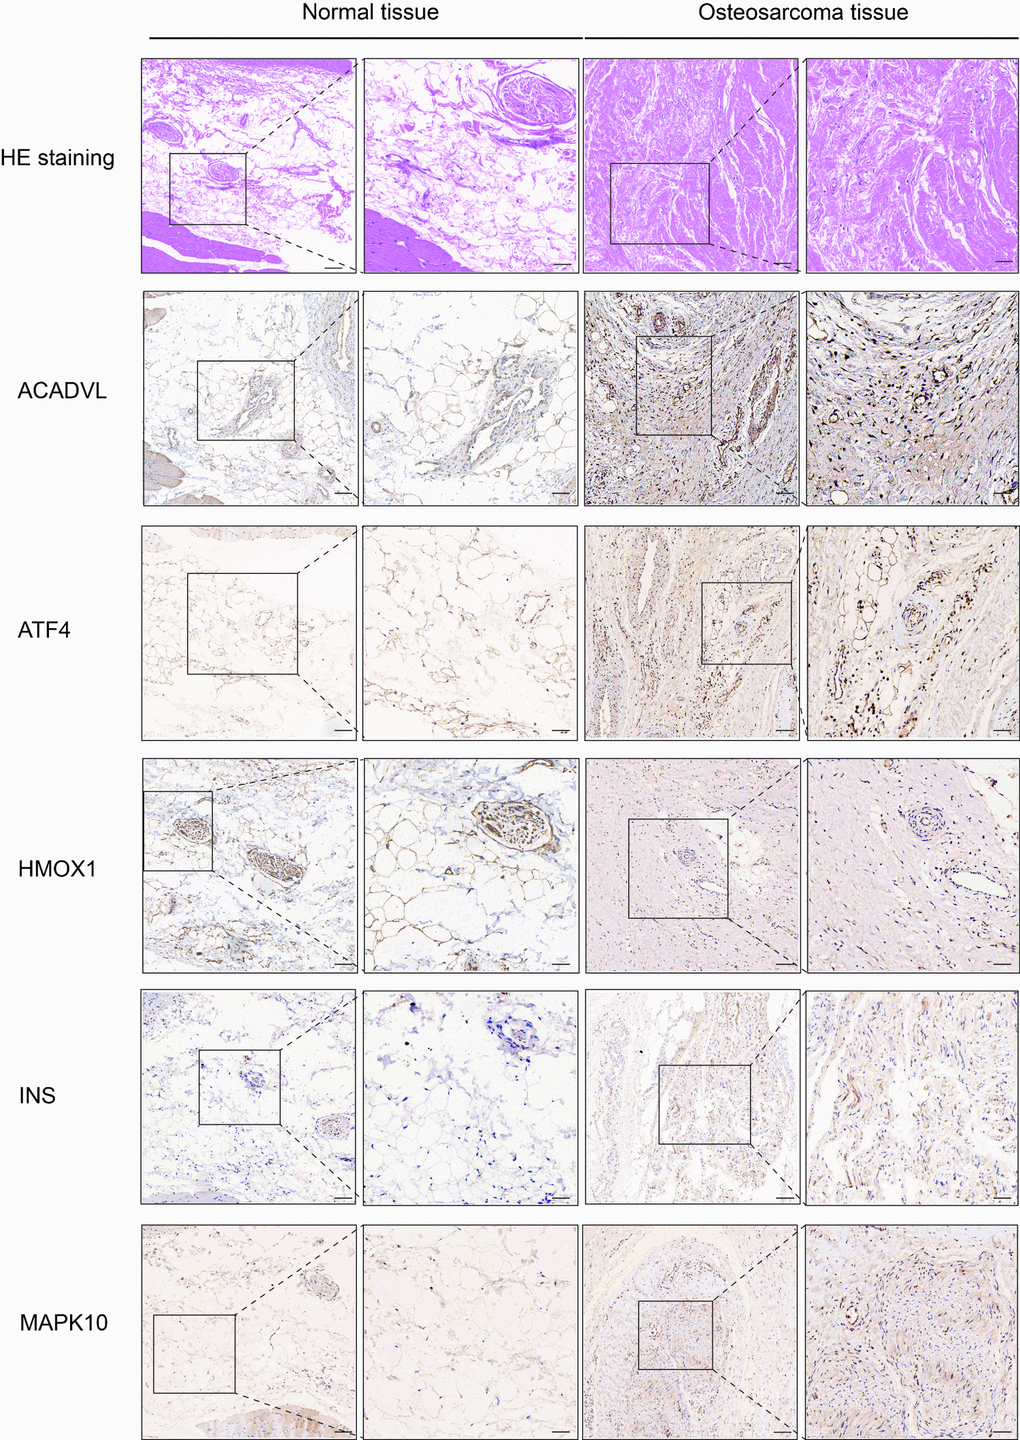
Figure 5. Hematoxylin eosin (HE) staining and immunohistochemistry (IHC) staining of normal and osteosarcoma tissue. Scale bar, 100 μm (left panel) and 50 μm (right panel).
Estimation of tumor immune microenvironment
We calculated the stromal score, immune score, and tumor purity in each sample in the TARGET and GSE21257 datasets using the ESTIMATE algorithm. We also compared the abovementioned parameters between the high- and low-risk groups, and found that patients in the high-risk group with lower stromal score had better overall survival, compared with those with higher stromal scores (p < 0.0001, Figure 6A, 6D). However, a higher immune score was associated with better overall survival as opposed to a lower immune score in the high-risk group (p < 0.0001, Figure 6B, 6E). High risk group of training and validation group had higher tumor purity than low risk group (Figure 6C, 6F). Thus, OS-related prognostic genes are associated with the immune microenvironment of osteosarcoma, and may be able to predict the efficacy of immunotherapy. Then risk score was combined with stromal score and immune score as shown in Figure 6G and 6H, which illustrated the survival relationship of tumor immune microenvironment score.
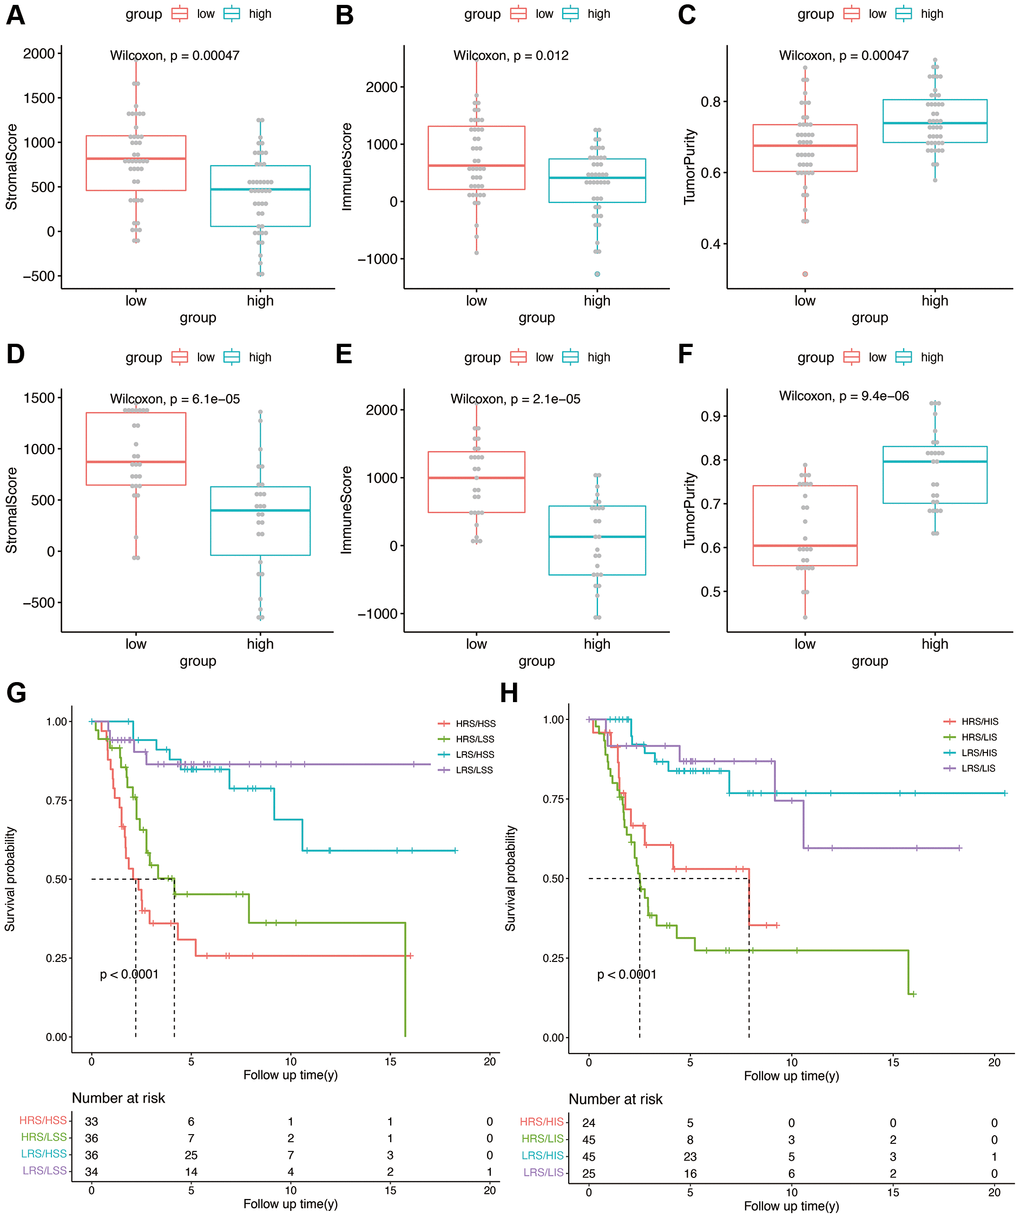
Figure 6. (A–C) Stromal score, immune score, and tumor purity in the high- and low-risk groups in the TARGET cohort. (D–F) Stromal score, immune score, and tumor purity in the high- and low-risk groups in the validation cohort. (G) Kaplan-Meier analysis combining risk score and stromal score. (H) Kaplan-Meier analysis combining risk score and immune score.
Tumor-infiltrating immune cells using OS-related risk score
Immune-related pathway GSVA revealed that macrophages were well enriched between high- and low-risk groups (Figure 7A). The CIBERSORT algorithm was used to evaluate the infiltration of 22 immune cell populations in the TARGET and GSE21257 osteosarcoma samples (Figure 7B and 7C). M0 and M2 macrophages were the top 2 infiltrating cell types in both cohorts. In the TARGET cohort, there was a significant difference in the abundance of infiltrating gamma delta T cells between the high- and low-risk groups (Figure 7B). In contrast, significant differences were observed in the infiltration of plasma cells, CD8 T cells, CD4 naïve T cells, CD4 memory T cells, regulatory T cells, and M2 macrophages between the high- and low-risk groups in the GSE21257 cohort (Figure 7C). These results suggested that the OS-related model is associated with the immunological status of the osteosarcoma microenvironment.
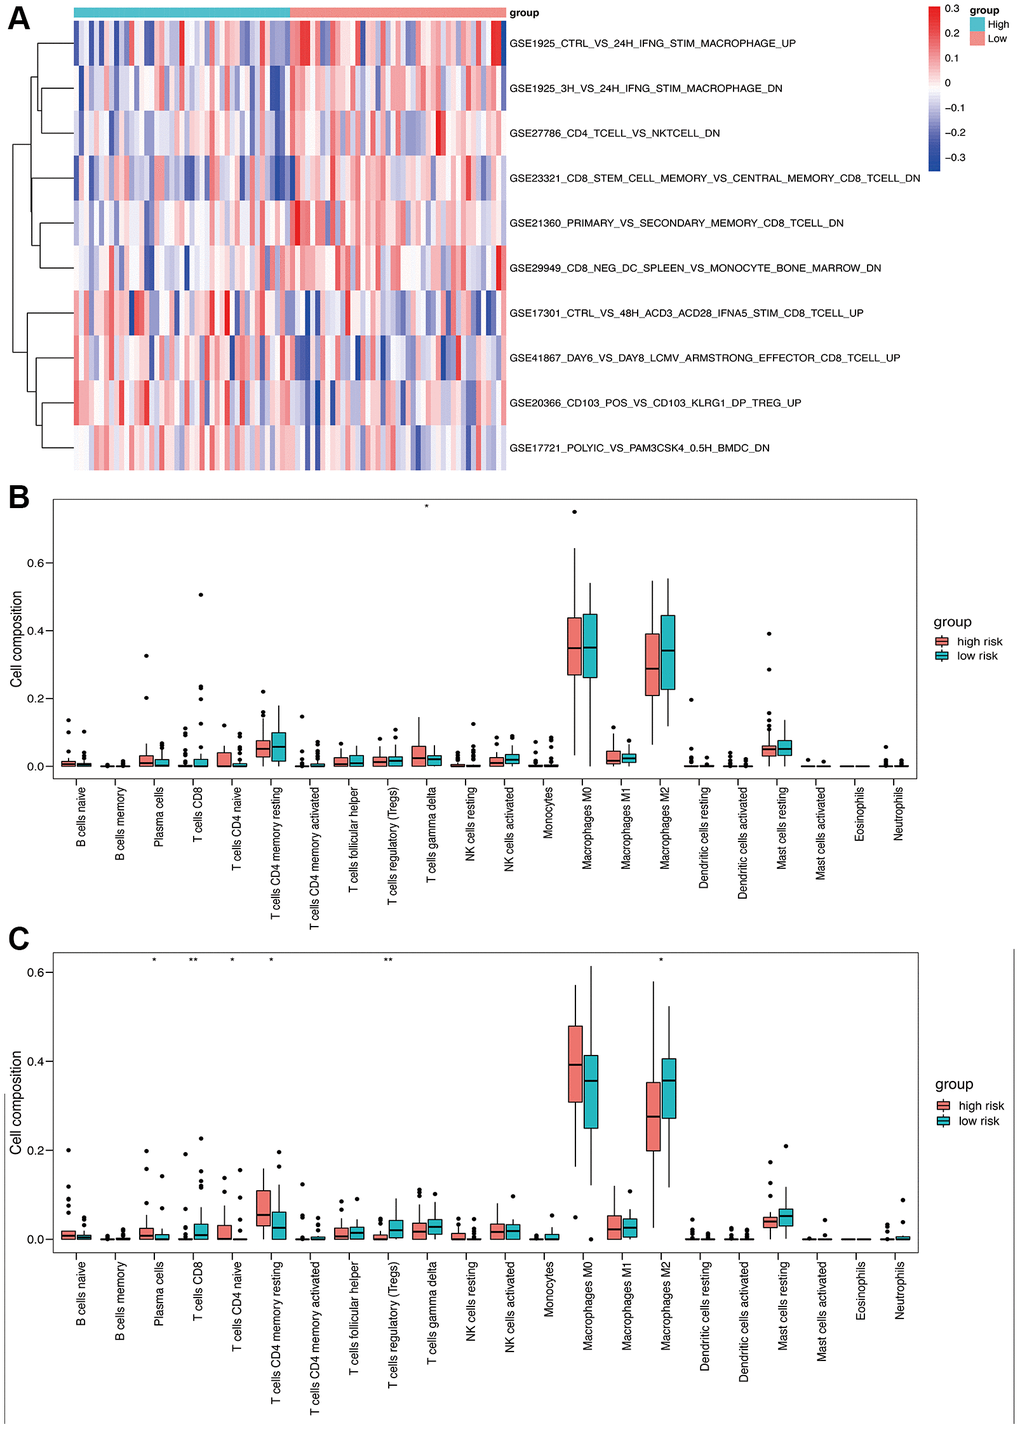
Figure 7. Immune analysis based on high- and low-risk groups. (A) Immune-related pathway GSVA between high- and low-risk groups. (B) Box plot of 22 immune cells in the high- and low-risk groups of the training cohort. (C) Box plot of 22 immune cells in the high- and low-risk groups of the validation cohort.
Sensitivity to immunotherapy and tumor mutation burden analysis
To explore sensitivity to immunotherapy, we performed further expression analysis for the possible immunotherapy target. The expression of several representative immune checkpoint genes is shown in Figure 8A–8H. We found that the expression of CD274 (PDL1), CXCL12, BTN3A1, LAG3, and IL10 was significantly decreased in the high-risk group of our model. No significant difference was found in the term of PDCD1(PD1), CTLA4 and CYT score. Figure 8I showed the gene mutation profiles of the high- and low-risk groups. With the application of maftools package, it can be observed that the proportion of mutated genes is not high, with p53 being the most frequently mutated gene. There is no significant difference between the high- and low-risk groups in terms of gene mutations.
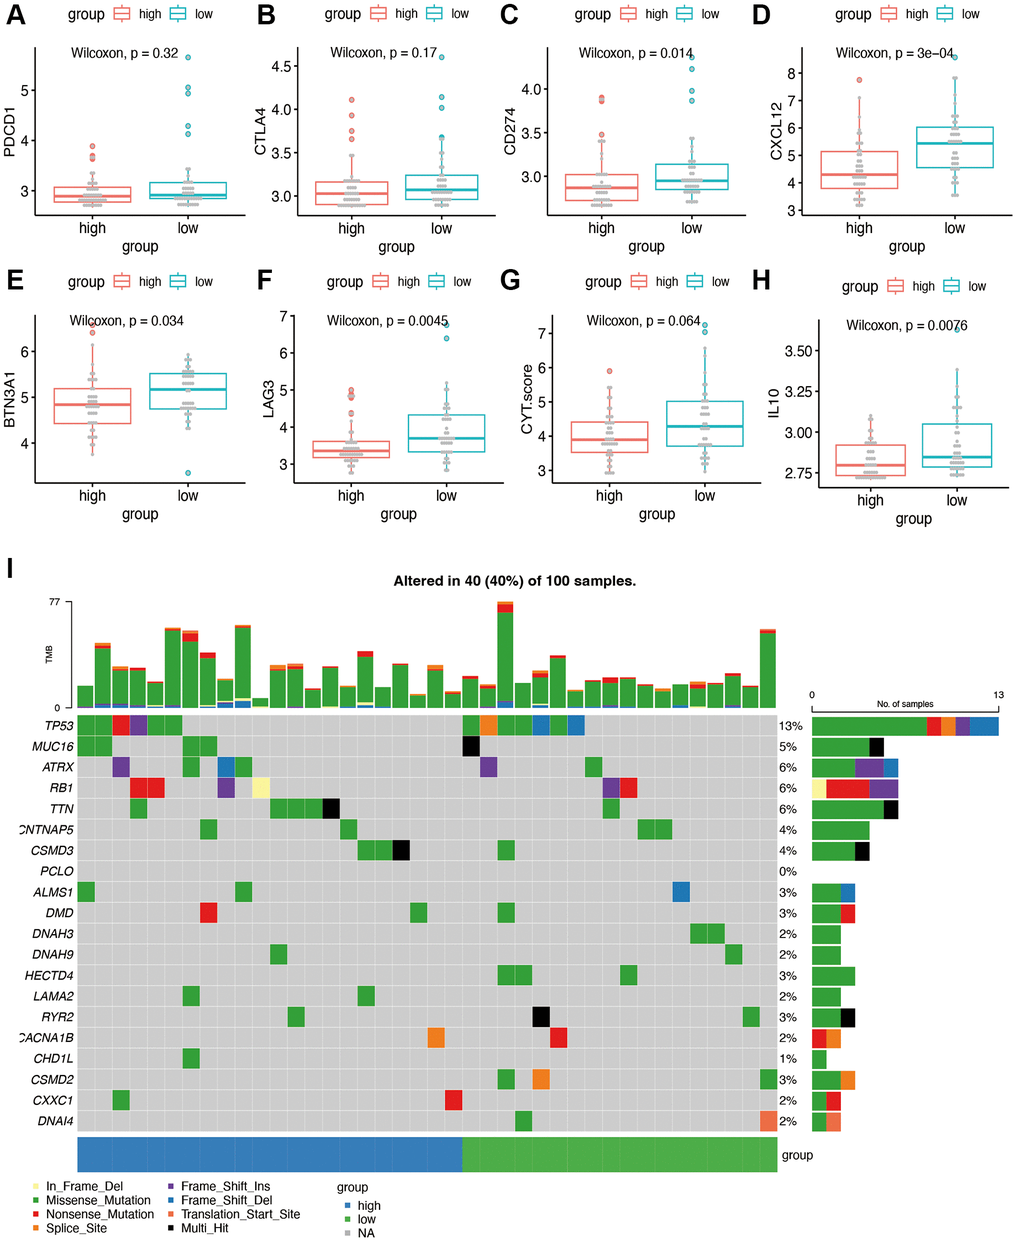
Figure 8. Immunotherapy sensitivity and tumor mutation burden analysis. (A–H) Expression levels of representative immune checkpoints between high and low risk group. (I) Tumor mutation analysis of high and low risk group.
Construction and validation of the nomogram
We constructed a nomogram by integrating the OS-related prognostic model and clinical characteristics including gender, race, and metastasis status. As shown in Figure 9A, each item was assigned a score and the total score of each patient predicted the probability of survival in 1, 3, and 5-years. The Forest plot of the nomogram revealed that metastasis and risk score showed significant prognostic value in the cohort (Figure 9B). The accuracy of the nomogram was validated in the TARGET cohort (Figure 9C and 9D), and the results indicated a good fit between the predicted and actual 3- and 5-year survival rates.
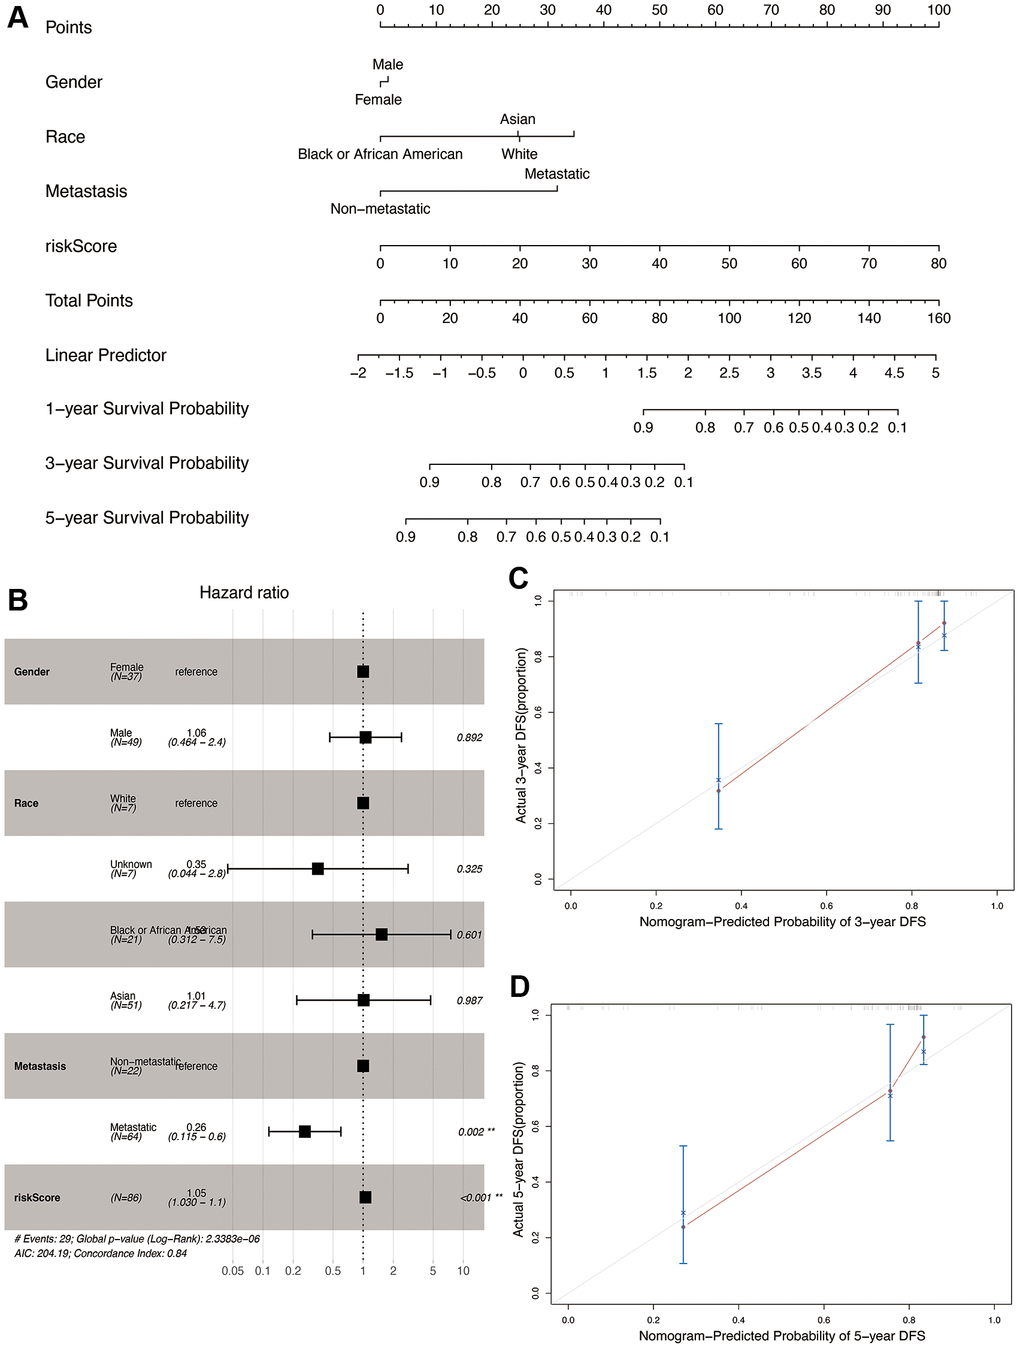
Figure 9. Construction and validation of the nomogram in the TARGET cohort. (A) Nomogram combining OS-related risk score and clinical characteristics for predicting 1-, 3-, and 5-year overall survival of osteosarcoma patients. (B) Forest plot showing results of multivariable cox regression of the nomogram. (C, D) The calibration curves for 3- and 5-year overall survival probability.
Single cell expression of OS-related mRNAs
We identified 23 immune cell subpopulations in the GSE162454 dataset by TSNE analysis at first. Based on the specific markers, we identified NK/T cells, CAFs (cancer associated fibroblasts), endothelial cells, plasma cells, osteoblastic cells, osteoclasts, B cells, M2 TAMs (tumor associated macrophages), M1 TAMs, monocytes and mast cells (Figure 10A). The expression of marker genes for different cell clusters was displayed in dot plot format in Figure 10B. The expression of OS-related genes was compared in different cell types. Because of the dropout sign of single-cell sequencing, INS was not detected in the GSE162454 dataset. As shown in Figure 10C, HMOX1 were expressed at higher levels in TAMs and osteoclasts. ATF4 and ACADVL are highly expressed in myeloid cells as well as other cell types, which was suggestive of their roles in osteosarcoma progression.
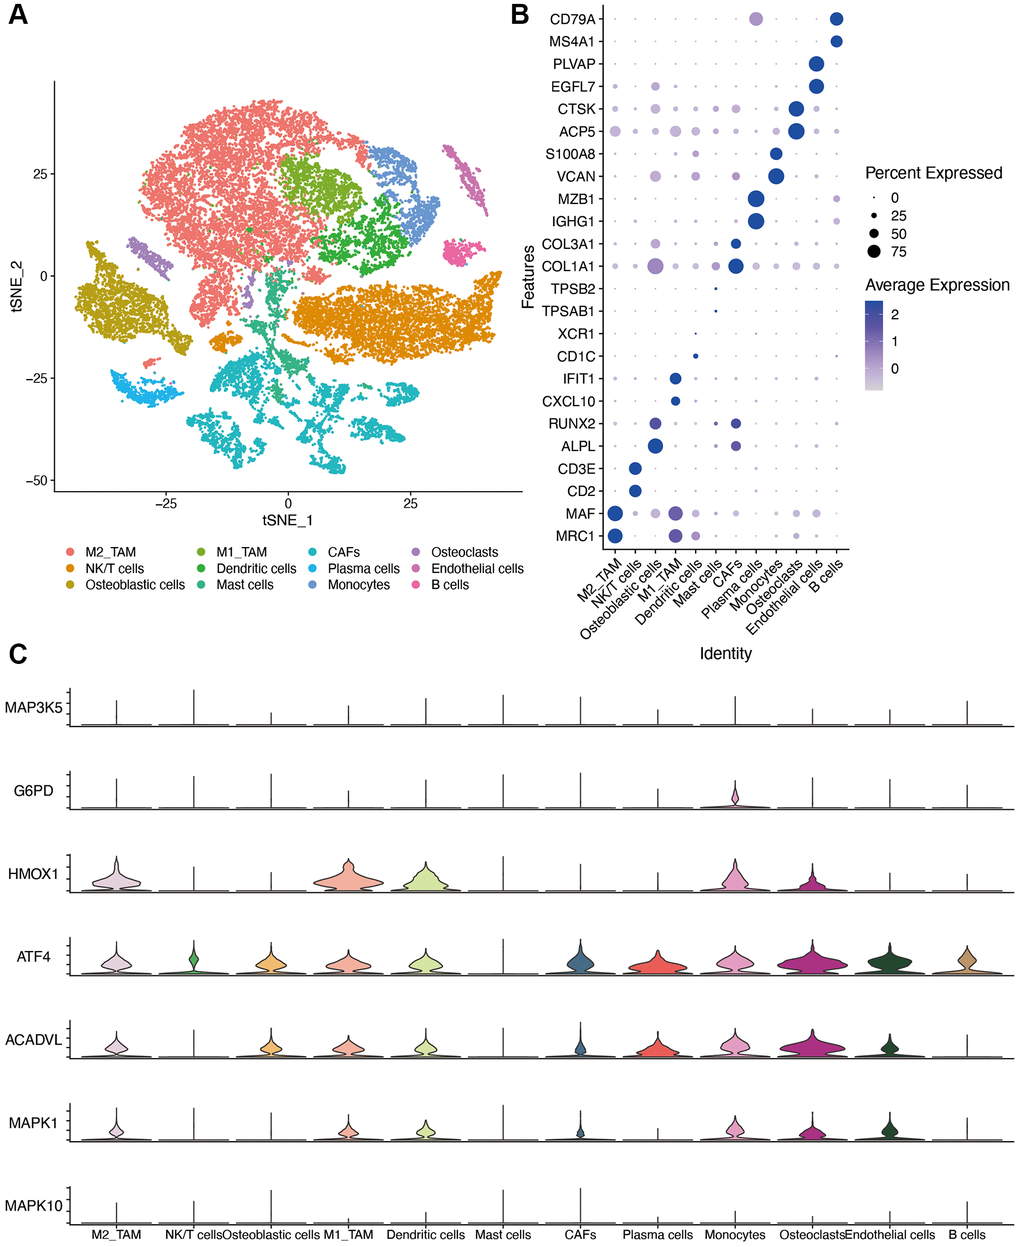
Figure 10. Single-cell sequencing dataset analysis. (A) The TSNE plot of 12 cell clusters of GSE162454. (B) Dot plot showing the expression levels of marker gene in single cell sequencing data. (C) violin plot of OS-related genes in different cell types. Abbreviations: CAF: cancer associated fibroblasts; TAM: tumor associated macrophages.
Discussion
Nearly 10 million adolescents are diagnosed with osteosarcoma each year [38]. Because of the anatomical features of bone tissues, chemotherapeutics have not achieved satisfactory response in bone malignancies [39]. OS, which is reflected in the excessive accumulation of ROS, frequently initiates tumorigenesis by promoting lipid oxidation and DNA damage [40]. Therefore, it is crucial to identify the OS-related genes in osteosarcoma and other cancers to increase the repertoire of therapeutic targets. In the present study, we analyzed the high-throughput RNA-sequencing data and clinical information of 86 osteosarcoma patients, and identified eight prognosis-related genes, including MAP3K5, G6PD, HMOX1, ATF4, ACADVL, MAPK1, MAPK10, and INS. An OS-related risk model was developed for predicting patient prognosis. With the combination of expressions of these eight genes, the risk scores had better prognostic performance than with individual gene expressions. Because the OS-related prognostic genes were enriched in immune-related functions, we analyzed the relationship between the risk model and the immunological characteristics of the TME, and observed significant differences in the infiltrating immune cell populations between the high- and low-risk groups. Furthermore, analysis of single cell sequencing results indicated that the OS-related genes were expressed in different cell types, which offers insights into potential treatment strategies for osteosarcoma.
In the field of osteosarcoma, multiple gene sets related to patient prognosis, such as ferroptosis-related genes, immune-related genes, and lipid metabolism genes, have been found [41–43]. However, whether OS-related genes can predict patient outcomes has not been investigated. In this study, the risk scores of patients were calculated based on the expressions of eight OS-related genes, and patients were divided into high- and low-risk groups according to the median number. The difference in survival time between the two groups was statistically significant.
MAP3K5 is a serine/threonine kinase that mediates the MAP kinase signal transduction pathway [44] in different cancer types, such as pancreatic cancer [45], prostate cancer [46], and thyroid cancer [47]. It is also a ferroptosis-related gene associated with increased ROS accumulation [48]. G6PD is the first and the rate-limiting enzyme in the pentose phosphate pathway, as well as an antioxidant enzyme involved in the ribose 5-phosphate pathway for nucleotide synthesis. Wang et al. found that G6PD inhibition upregulated ROS levels in osteosarcoma cells and induced endoplasmic reticulum (ER) stress, which is consistent with the decreased survival rates observed in the G6PDlow group in our cohort. HMOX1 is a cytoprotective enzyme and its overexpression in U-2OS cells has been reported to significantly decrease cell proliferation rates by inducing ferroptosis [49]. Further, ATF4 is a master transcriptional regulator of amino acid metabolism and stress responses [50], and induces apoptosis in response to persistent stress conditions through post-transcriptional modifications. ACADVL is an inner mitochondrial membrane protein and catalyzes the first step of the mitochondrial fatty acid beta-oxidation pathway [51]. However, there are currently no reports on the possible role of ACADVL in osteosarcoma.
The mitogen-activated protein kinase (MAPK) family of proteins integrate various upstream signals to regulate multiple cellular functions, including proliferation, differentiation, and survival. MAPK1 is overexpressed in breast cancer [52], lung cancer [53], ovarian cancer [54], and other malignancies. Several studies have shown that MAPK1 is targeted by non-coding RNAs to modulate the invasion and proliferation of osteosarcoma cells [55, 56]. MAPK10 is also associated with the prognosis of renal cell carcinoma [57] and hepatocellular carcinoma [58]. INS encodes insulin, a peptide hormone that plays a vital role in the regulation of carbohydrate and lipid metabolism, and is aberrantly expressed in various diseases. Gene expression microarray analysis in a previous study identified INS as one of the core genes in osteosarcoma with pulmonary metastasis [59]. In this study, we found significant differences between the prognosis of patients with low and high expression levels of ACADVL, ATF4, HMOX1, INS, and MAPK10, indicating that these genes are potential therapeutic targets of osteosarcoma.
We further validated the OS-related risk model in an external cohort, and the ROC curve analysis showed high predictive accuracy of the model in both the training and validation cohorts. In addition, the nomogram integrating the risk score and clinical characteristics also reliably predicted the prognosis of osteosarcoma.
The immune microenvironment has been illustrated to have a significant effect on the prognosis of several diseases. Previous studies have shown that lower immune scores are associated with worse prognosis in osteosarcoma [60, 61]. GO analysis based on the risk score in our study illustrated several immune related terms. We found that the high-risk group had significantly higher tumor purity but lower stromal score and immune score in both the training and validation sets, which correlated with a worse prognosis. Myeloid cells, including macrophages, microglia, myeloid-derived suppressor cells, dendritic cells and neutrophils [62], are the predominant infiltrating immune cell populations in the TME, and regulate immune and therapeutic responses [63]. Xiao et al. developed a macrophage-associated risk model for osteosarcoma, which included MAP3K5 as one of the prognosis-related genes [61]. Our results also found that the potential sensitive immune checkpoint such as PDL1, CXCL12, BTN3A1, LAG3, and IL10, were differently expressed between high- and low- risk groups, which provide new therapy target.
Analysis of a single cell sequencing dataset also showed that most of the OS-related genes were highly expressed in myeloid cells in addition to their high expression in osteoblasts and osteoclasts. This warrants further investigation of the function of these genes in osteosarcoma. To summarize, our OS-related risk model is a potential indicator of the prognosis of osteosarcoma patients.
Our study has some limitations that ought to be considered. First, the sample size in our study was small compared with that in other similar studies. Second, the clinical data of the patients were not sufficient, and some key information such as the tumor stage and pathological type could not be included in the nomogram. Third, this study was based on sequencing data and bioinformatics analysis, and the results will have to be validated through in vitro and in vivo studies.
Conclusions
We constructed a prognostic risk model for osteosarcoma based on eight OS-related genes. The model could accurately predict patient prognosis and its performance was validated in an external cohort. In addition, the risk groups classified on the basis of the gene risk score showed significant differences in the immune microenvironment, some immune checkpoints showed difference between high and low risk groups. OS-related genes were highly expressed in myeloid cells. In conclusion, OS-related genes possibly regulate the immune responses in osteosarcoma, and may predict patient response to immunotherapies.
Author Contributions
Hanning Wang proposed the research question, designed the experimental plan, analyzed the data, and wrote the manuscript. Juntan Li conducted data analysis and R code operation. Hanning Wang and Juntan Li contributed equally to this article. Xu Li provided guidance on research direction, experimental design, and manuscript revisions.
Conflicts of Interest
The authors declare no conflicts of interest related to this study.
Ethical Statement and Consent
The present study was approved by the ethics committee of the First Affiliated Hospital of China Medical University with the registration number 2019-285-2. A consent form was signed by each participant.
Funding
This study was funded by the Education Science Foundation of Liaoning province (JC2019001).
Editorial Note
This corresponding author has a verified history of publications using a personal email address for correspondence.
References
- 1. Kumar R, Kumar M, Malhotra K, Patel S. Primary Osteosarcoma in the Elderly Revisited: Current Concepts in Diagnosis and Treatment. Curr Oncol Rep. 2018; 20:13. https://doi.org/10.1007/s11912-018-0658-1 [PubMed]
- 2. Nacev BA, Sanchez-Vega F, Smith SA, Antonescu CR, Rosenbaum E, Shi H, Tang C, Socci ND, Rana S, Gularte-Mérida R, Zehir A, Gounder MM, Bowler TG, et al. Clinical sequencing of soft tissue and bone sarcomas delineates diverse genomic landscapes and potential therapeutic targets. Nat Commun. 2022; 13:3405. https://doi.org/10.1038/s41467-022-30453-x [PubMed]
- 3. Gianferante DM, Mirabello L, Savage SA. Germline and somatic genetics of osteosarcoma - connecting aetiology, biology and therapy. Nat Rev Endocrinol. 2017; 13:480–91. https://doi.org/10.1038/nrendo.2017.16 [PubMed]
- 4. Tempelaere C, Biau D, Babinet A, Anract P. Osteosarcoma after the age of fifty: A clinicopathological study. Eur J Surg Oncol. 2019; 45:1288–92. https://doi.org/10.1016/j.ejso.2019.04.010 [PubMed]
- 5. Trela A, Szymańska R. Less widespread plant oils as a good source of vitamin E. Food Chem. 2019; 296:160–6. https://doi.org/10.1016/j.foodchem.2019.05.185 [PubMed]
- 6. Gill J, Gorlick R. Advancing therapy for osteosarcoma. Nat Rev Clin Oncol. 2021; 18:609–24. https://doi.org/10.1038/s41571-021-00519-8 [PubMed]
- 7. Czarnecka AM, Synoradzki K, Firlej W, Bartnik E, Sobczuk P, Fiedorowicz M, Grieb P, Rutkowski P. Molecular Biology of Osteosarcoma. Cancers (Basel). 2020; 12:2130. https://doi.org/10.3390/cancers12082130 [PubMed]
- 8. Boulouis HJ, Chomel BB, Guillaume G, Benoît D, Chang CC, Monteil M, Kasten RW, Jack A, Nadia H. Multiple locus variable number tandem repeat analysis for the characterization of wild feline Bartonella species and subspecies. Vet Microbiol. 2020; 247:108788. https://doi.org/10.1016/j.vetmic.2020.108788 [PubMed]
- 9. Ho XD, Nguyen HG, Trinh LH, Reimann E, Prans E, Kõks G, Maasalu K, Le VQ, Nguyen VH, Le NTN, Phung P, Märtson A, Lattekivi F, Kõks S. Analysis of the Expression of Repetitive DNA Elements in Osteosarcoma. Front Genet. 2017; 8:193. https://doi.org/10.3389/fgene.2017.00193 [PubMed]
- 10. Ho XD, Phung P, Le VQ, Nguyen VH, Reimann E, Prans E, Kõks G, Maasalu K, Le NT, Trinh LH, Nguyen HG, Märtson A, Kõks S. Whole transcriptome analysis identifies differentially regulated networks between osteosarcoma and normal bone samples. Exp Biol Med (Maywood). 2017; 242:1802–11. https://doi.org/10.1177/1535370217736512 [PubMed]
- 11. Pisoschi AM, Pop A. The role of antioxidants in the chemistry of oxidative stress: A review. Eur J Med Chem. 2015; 97:55–74. https://doi.org/10.1016/j.ejmech.2015.04.040 [PubMed]
- 12. Ďuračková Z. Some current insights into oxidative stress. Physiol Res. 2010; 59:459–69. https://doi.org/10.33549/physiolres.931844 [PubMed]
- 13. Multhaup G, Ruppert T, Schlicksupp A, Hesse L, Beher D, Masters CL, Beyreuther K. Reactive oxygen species and Alzheimer's disease. Biochem Pharmacol. 1997; 54:533–9. https://doi.org/10.1016/s0006-2952(97)00062-2 [PubMed]
- 14. Muhammad S, Bierhaus A, Schwaninger M. Reactive oxygen species in diabetes-induced vascular damage, stroke, and Alzheimer's disease. J Alzheimers Dis. 2009; 16:775–85. https://doi.org/10.3233/JAD-2009-0982 [PubMed]
- 15. Gelderman KA, Hultqvist M, Olsson LM, Bauer K, Pizzolla A, Olofsson P, Holmdahl R. Rheumatoid arthritis: the role of reactive oxygen species in disease development and therapeutic strategies. Antioxid Redox Signal. 2007; 9:1541–67. https://doi.org/10.1089/ars.2007.1569 [PubMed]
- 16. Miyajima A, Nakashima J, Yoshioka K, Tachibana M, Tazaki H, Murai M. Role of reactive oxygen species in cis-dichlorodiammineplatinum-induced cytotoxicity on bladder cancer cells. Br J Cancer. 1997; 76:206–10. https://doi.org/10.1038/bjc.1997.363 [PubMed]
- 17. Brown NS, Bicknell R. Hypoxia and oxidative stress in breast cancer. Oxidative stress: its effects on the growth, metastatic potential and response to therapy of breast cancer. Breast Cancer Res. 2001; 3:323–7. https://doi.org/10.1186/bcr315 [PubMed]
- 18. Ranjan P, Anathy V, Burch PM, Weirather K, Lambeth JD, Heintz NH. Redox-dependent expression of cyclin D1 and cell proliferation by Nox1 in mouse lung epithelial cells. Antioxid Redox Signal. 2006; 8:1447–59. https://doi.org/10.1089/ars.2006.8.1447 [PubMed]
- 19. Forman HJ, Zhang H. Targeting oxidative stress in disease: promise and limitations of antioxidant therapy. Nat Rev Drug Discov. 2021; 20:689–709. https://doi.org/10.1038/s41573-021-00233-1 [PubMed]
- 20. Nathan FM, Singh VA, Dhanoa A, Palanisamy UD. Oxidative stress and antioxidant status in primary bone and soft tissue sarcoma. BMC Cancer. 2011; 11:382. https://doi.org/10.1186/1471-2407-11-382 [PubMed]
- 21. Sisubalan N, Ramkumar VS, Pugazhendhi A, Karthikeyan C, Indira K, Gopinath K, Hameed ASH, Basha MHG. ROS-mediated cytotoxic activity of ZnO and CeO2 nanoparticles synthesized using the Rubia cordifolia L. leaf extract on MG-63 human osteosarcoma cell lines. Environ Sci Pollut Res Int. 2018; 25:10482–92. https://doi.org/10.1007/s11356-017-0003-5 [PubMed]
- 22. Pu Y, Tan Y, Zang C, Zhao F, Cai C, Kong L, Deng H, Chao F, Xia R, Xie M, Ge F, Pan Y, Cai S, Huang D. LAMTOR5-AS1 regulates chemotherapy-induced oxidative stress by controlling the expression level and transcriptional activity of NRF2 in osteosarcoma cells. Cell Death Dis. 2021; 12:1125. https://doi.org/10.1038/s41419-021-04413-0 [PubMed]
- 23. Hu H, Yang W, Liang Z, Zhou Z, Song Q, Liu W, Deng X, Zhu J, Xing X, Zhong B, Wang B, Wang S, Shao Z, Zhang Y. Amplification of oxidative stress with lycorine and gold-based nanocomposites for synergistic cascade cancer therapy. J Nanobiotechnology. 2021; 19:221. https://doi.org/10.1186/s12951-021-00933-1 [PubMed]
- 24. Chen C, Xie L, Ren T, Huang Y, Xu J, Guo W. Immunotherapy for osteosarcoma: Fundamental mechanism, rationale, and recent breakthroughs. Cancer Lett. 2021; 500:1–10. https://doi.org/10.1016/j.canlet.2020.12.024 [PubMed]
- 25. Miwa S, Shirai T, Yamamoto N, Hayashi K, Takeuchi A, Igarashi K, Tsuchiya H. Current and Emerging Targets in Immunotherapy for Osteosarcoma. J Oncol. 2019; 2019:7035045. https://doi.org/10.1155/2019/7035045 [PubMed]
- 26. Tao L, Huang G, Song H, Chen Y, Chen L. Cancer associated fibroblasts: An essential role in the tumor microenvironment. Oncol Lett. 2017; 14:2611–20. https://doi.org/10.3892/ol.2017.6497 [PubMed]
- 27. Buddingh EP, Kuijjer ML, Duim RA, Bürger H, Agelopoulos K, Myklebost O, Serra M, Mertens F, Hogendoorn PC, Lankester AC, Cleton-Jansen AM. Tumor-infiltrating macrophages are associated with metastasis suppression in high-grade osteosarcoma: a rationale for treatment with macrophage activating agents. Clin Cancer Res. 2011; 17:2110–9. https://doi.org/10.1158/1078-0432.CCR-10-2047 [PubMed]
- 28. Ritchie ME, Phipson B, Wu D, Hu Y, Law CW, Shi W, Smyth GK. limma powers differential expression analyses for RNA-sequencing and microarray studies. Nucleic Acids Res. 2015; 43:e47. https://doi.org/10.1093/nar/gkv007 [PubMed]
- 29. Leek JT. svaseq: removing batch effects and other unwanted noise from sequencing data. Nucleic Acids Res. 2014; 42:e161. https://doi.org/10.1093/nar/gku864 [PubMed]
- 30. Liu Y, Feng W, Dai Y, Bao M, Yuan Z, He M, Qin Z, Liao S, He J, Huang Q, Yu Z, Zeng Y, Guo B, et al. Single-Cell Transcriptomics Reveals the Complexity of the Tumor Microenvironment of Treatment-Naive Osteosarcoma. Front Oncol. 2021; 11:709210. https://doi.org/10.3389/fonc.2021.709210 [PubMed]
- 31. Engebretsen S, Bohlin J. Statistical predictions with glmnet. Clin Epigenetics. 2019; 11:123. https://doi.org/10.1186/s13148-019-0730-1 [PubMed]
- 32. Tibshirani R. The lasso method for variable selection in the Cox model. Stat Med. 1997; 16:385–95. https://doi.org/10.1002/(sici)1097-0258(19970228)16:4<385::aid-sim380>3.0.co;2-3 [PubMed]
- 33. Heagerty PJ, Lumley T, Pepe MS. Time-dependent ROC curves for censored survival data and a diagnostic marker. Biometrics. 2000; 56:337–44. https://doi.org/10.1111/j.0006-341x.2000.00337.x [PubMed]
- 34. Hänzelmann S, Castelo R, Guinney J. GSVA: gene set variation analysis for microarray and RNA-seq data. BMC Bioinformatics. 2013; 14:7. https://doi.org/10.1186/1471-2105-14-7 [PubMed]
- 35. Yoshihara K, Shahmoradgoli M, Martínez E, Vegesna R, Kim H, Torres-Garcia W, Treviño V, Shen H, Laird PW, Levine DA, Carter SL, Getz G, Stemke-Hale K, et al. Inferring tumour purity and stromal and immune cell admixture from expression data. Nat Commun. 2013; 4:2612. https://doi.org/10.1038/ncomms3612 [PubMed]
- 36. Newman AM, Liu CL, Green MR, Gentles AJ, Feng W, Xu Y, Hoang CD, Diehn M, Alizadeh AA. Robust enumeration of cell subsets from tissue expression profiles. Nat Methods. 2015; 12:453–7. https://doi.org/10.1038/nmeth.3337 [PubMed]
- 37. Hao Y, Hao S, Andersen-Nissen E, Mauck WM
3rd , Zheng S, Butler A, Lee MJ, Wilk AJ, Darby C, Zager M, Hoffman P, Stoeckius M, Papalexi E, et al. Integrated analysis of multimodal single-cell data. Cell. 2021; 184:3573–87.e29. https://doi.org/10.1016/j.cell.2021.04.048 [PubMed] - 38. Stiller CA, Bielack SS, Jundt G, Steliarova-Foucher E. Bone tumours in European children and adolescents, 1978-1997. Report from the Automated Childhood Cancer Information System project. Eur J Cancer. 2006; 42:2124–35. https://doi.org/10.1016/j.ejca.2006.05.015 [PubMed]
- 39. Sauerbrey A, Bielack S, Kempf-Bielack B, Zoubek A, Paulussen M, Zintl F. High-dose chemotherapy (HDC) and autologous hematopoietic stem cell transplantation (ASCT) as salvage therapy for relapsed osteosarcoma. Bone Marrow Transplant. 2001; 27:933–7. https://doi.org/10.1038/sj.bmt.1703023 [PubMed]
- 40. Schieber M, Chandel NS. ROS function in redox signaling and oxidative stress. Curr Biol. 2014; 24:R453–62. https://doi.org/10.1016/j.cub.2014.03.034 [PubMed]
- 41. Qian H, Lei T, Hu Y, Lei P. Expression of Lipid-Metabolism Genes Is Correlated With Immune Microenvironment and Predicts Prognosis in Osteosarcoma. Front Cell Dev Biol. 2021; 9:673827. https://doi.org/10.3389/fcell.2021.673827 [PubMed]
- 42. Liu W, Xie X, Qi Y, Wu J. Exploration of Immune-Related Gene Expression in Osteosarcoma and Association With Outcomes. JAMA Netw Open. 2021; 4:e2119132. https://doi.org/10.1001/jamanetworkopen.2021.19132 [PubMed]
- 43. Lei T, Qian H, Lei P, Hu Y. Ferroptosis-related gene signature associates with immunity and predicts prognosis accurately in patients with osteosarcoma. Cancer Sci. 2021; 112:4785–98. https://doi.org/10.1111/cas.15131 [PubMed]
- 44. Luo Y, Gao S, Hao Z, Yang Y, Xie S, Li D, Liu M, Zhou J. Apoptosis signal-regulating kinase 1 exhibits oncogenic activity in pancreatic cancer. Oncotarget. 2016; 7:75155–64. https://doi.org/10.18632/oncotarget.12090 [PubMed]
- 45. Qiu CJ, Wang XB, Zheng ZR, Yang CZ, Lin K, Zhang K, Tu M, Jiang KR, Gao WT. Development and validation of a ferroptosis-related prognostic model in pancreatic cancer. Invest New Drugs. 2021; 39:1507–22. https://doi.org/10.1007/s10637-021-01114-5 [PubMed]
- 46. Pressinotti NC, Klocker H, Schäfer G, Luu VD, Ruschhaupt M, Kuner R, Steiner E, Poustka A, Bartsch G, Sültmann H. Differential expression of apoptotic genes PDIA3 and MAP3K5 distinguishes between low- and high-risk prostate cancer. Mol Cancer. 2009; 8:130. https://doi.org/10.1186/1476-4598-8-130 [PubMed]
- 47. Wang Y, Yang J, Chen S, Wang W, Teng L. Identification and Validation of a Prognostic Signature for Thyroid Cancer Based on Ferroptosis-Related Genes. Genes (Basel). 2022; 13:997. https://doi.org/10.3390/genes13060997 [PubMed]
- 48. Lei G, Zhuang L, Gan B. Targeting ferroptosis as a vulnerability in cancer. Nat Rev Cancer. 2022; 22:381–96. https://doi.org/10.1038/s41568-022-00459-0 [PubMed]
- 49. Lin H, Chen X, Zhang C, Yang T, Deng Z, Song Y, Huang L, Li F, Li Q, Lin S, Jin D. EF24 induces ferroptosis in osteosarcoma cells through HMOX1. Biomed Pharmacother. 2021; 136:111202. https://doi.org/10.1016/j.biopha.2020.111202 [PubMed]
- 50. Wortel IMN, van der Meer LT, Kilberg MS, van Leeuwen FN. Surviving Stress: Modulation of ATF4-Mediated Stress Responses in Normal and Malignant Cells. Trends Endocrinol Metab. 2017; 28:794–806. https://doi.org/10.1016/j.tem.2017.07.003 [PubMed]
- 51. Tcheng M, Roma A, Ahmed N, Smith RW, Jayanth P, Minden MD, Schimmer AD, Hess DA, Hope K, Rea KA, Akhtar TA, Bohrnsen E, D'Alessandro A, et al. Very long chain fatty acid metabolism is required in acute myeloid leukemia. Blood. 2021; 137:3518–32. https://doi.org/10.1182/blood.2020008551 [PubMed]
- 52. Niu L, Zhou Y, Zhang W, Ren Y. Long noncoding RNA LINC00473 functions as a competing endogenous RNA to regulate MAPK1 expression by sponging miR-198 in breast cancer. Pathol Res Pract. 2019; 215:152470. https://doi.org/10.1016/j.prp.2019.152470 [PubMed]
- 53. Jun T, Zheng FS, Ren KM, Zhang HY, Zhao JG, Zhao JZ. Long non-coding RNA UCA1 regulates the proliferation, migration and invasion of human lung cancer cells by modulating the expression of microRNA-143. Eur Rev Med Pharmacol Sci. 2018; 22:8343–52. https://doi.org/10.26355/eurrev_201812_16532 [PubMed]
- 54. Xu M, Zhou K, Wu Y, Wang L, Lu S. Linc00161 regulated the drug resistance of ovarian cancer by sponging microRNA-128 and modulating MAPK1. Mol Carcinog. 2019; 58:577–87. https://doi.org/10.1002/mc.22952 [PubMed]
- 55. Wu J, Zhang C, Chen L. MiR-511 mimic transfection inhibits the proliferation, invasion of osteosarcoma cells and reduces metastatic osteosarcoma tumor burden in nude mice via targeting MAPK1. Cancer Biomark. 2019; 26:343–51. https://doi.org/10.3233/CBM-190534 [PubMed]
- 56. Jerez S, Araya H, Hevia D, Irarrázaval CE, Thaler R, van Wijnen AJ, Galindo M. Extracellular vesicles from osteosarcoma cell lines contain miRNAs associated with cell adhesion and apoptosis. Gene. 2019; 710:246–57. https://doi.org/10.1016/j.gene.2019.06.005 [PubMed]
- 57. Tsai YC, Huang CY, Hsueh YM, Fan YC, Fong YC, Huang SP, Geng JH, Chen LC, Lu TL, Bao BY. Genetic variants in MAPK10 modify renal cell carcinoma susceptibility and clinical outcomes. Life Sci. 2021; 275:119396. https://doi.org/10.1016/j.lfs.2021.119396 [PubMed]
- 58. Li H, Li Y, Zhang Y, Tan B, Huang T, Xiong J, Tan X, Ermolaeva MA, Fu L. MAPK10 Expression as a Prognostic Marker of the Immunosuppressive Tumor Microenvironment in Human Hepatocellular Carcinoma. Front Oncol. 2021; 11:687371. https://doi.org/10.3389/fonc.2021.687371 [PubMed]
- 59. Shi Z, Zhou H, Pan B, Lu L, Wei Z, Shi L, Yao X, Kang Y, Feng S. Exploring the key genes and pathways of osteosarcoma with pulmonary metastasis using a gene expression microarray. Mol Med Rep. 2017; 16:7423–31. https://doi.org/10.3892/mmr.2017.7577 [PubMed]
- 60. Zhang C, Zheng JH, Lin ZH, Lv HY, Ye ZM, Chen YP, Zhang XY. Profiles of immune cell infiltration and immune-related genes in the tumor microenvironment of osteosarcoma. Aging (Albany NY). 2020; 12:3486–501. https://doi.org/10.18632/aging.102824 [PubMed]
- 61. Xiao KW, Liu ZB, Zeng ZH, Yan FF, Xiao LF, Li JL, Cai L. Construction and Validation of a Macrophage-Associated Risk Model for Predicting the Prognosis of Osteosarcoma. J Oncol. 2021; 2021:9967954. https://doi.org/10.1155/2021/9967954 [PubMed]
- 62. Engblom C, Pfirschke C, Pittet MJ. The role of myeloid cells in cancer therapies. Nat Rev Cancer. 2016; 16:447–62. https://doi.org/10.1038/nrc.2016.54 [PubMed]
- 63. De Leo A, Ugolini A, Veglia F. Myeloid Cells in Glioblastoma Microenvironment. Cells. 2020; 10:18. https://doi.org/10.3390/cells10010018 [PubMed]