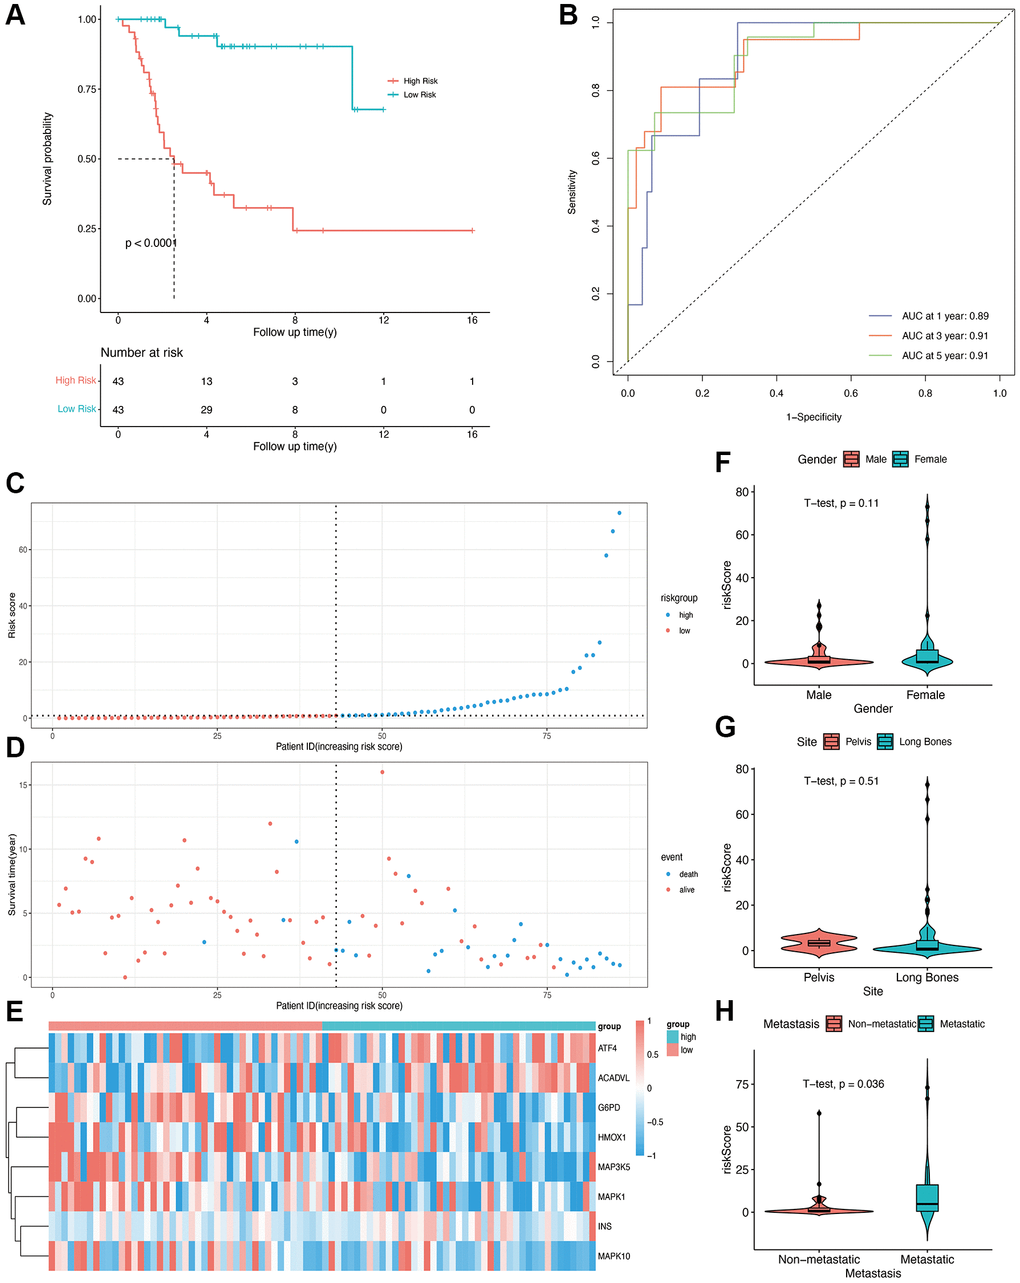
Figure 2.Construction of OS-related prognostic model for osteosarcoma in the TARGET cohort. (A) Kaplan-Meier curves showing the overall survival in the high-risk and low-risk groups (p < 0.0001). (B) AUCs for 1-, 3-, and 5-year survival according to the ROC curves. (C) The risk score curve of each patient. (D) The distribution of survival status. (E) The heatmap of eight OS-related genes between the high- and low-risk groups. (F, G, H) Risk scores in the gender, site, and metastasis subgroups.