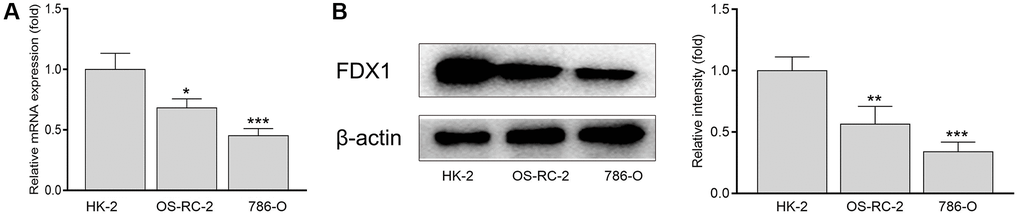
Figure 3.mRNA (A) and protein levels (B) of FDX1 in renal cancer cells and normal kidney cells. *P < 0.05, **P < 0.01 compared with the HK-2 group.
Figure 3 — Confirmation of the predictive function of cuproptosis-related gene FDX1 in clear cell renal carcinoma using qRT-PCR and western blotting | Aging