Submit an Article
Navigate
Home
Editorial Board
Editorial Policies
Current Volume
Archive
Scientific Integrity
Publication Ethics Statements
Interviews with Outstanding Authors
Newsroom
Sponsored Conferences
Podcast
Contact
Special Collections
Submit an Article
Online ISSN: 1945-4589
Research Paper
|
Volume 15, Issue 13
|
pp. 6152–6162
Machine learning models predict the mTOR signal pathway-related signature in the gastric cancer involving 2063 samples of 7 centers
Back to article
Figure 5
(5 of 6)
−
100%
+
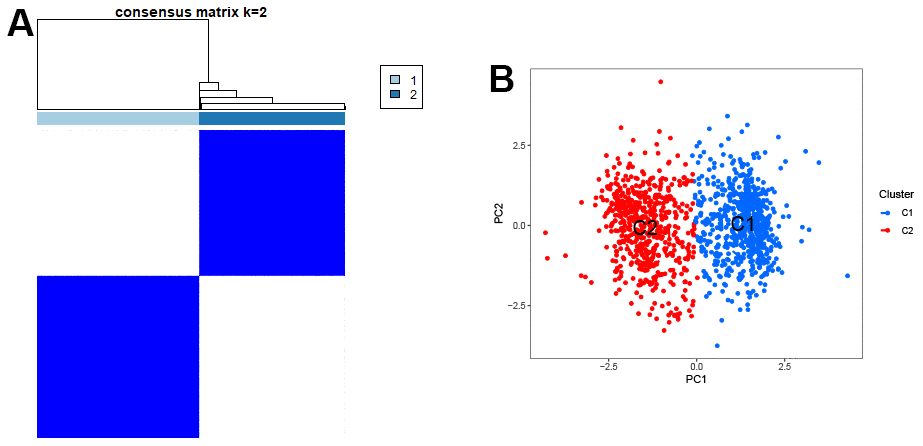
Figure 5.
Clustering of characteristic genes.
(
A
) Typing of characteristic genes for samples. (
B
) The scatter plot of PCA.