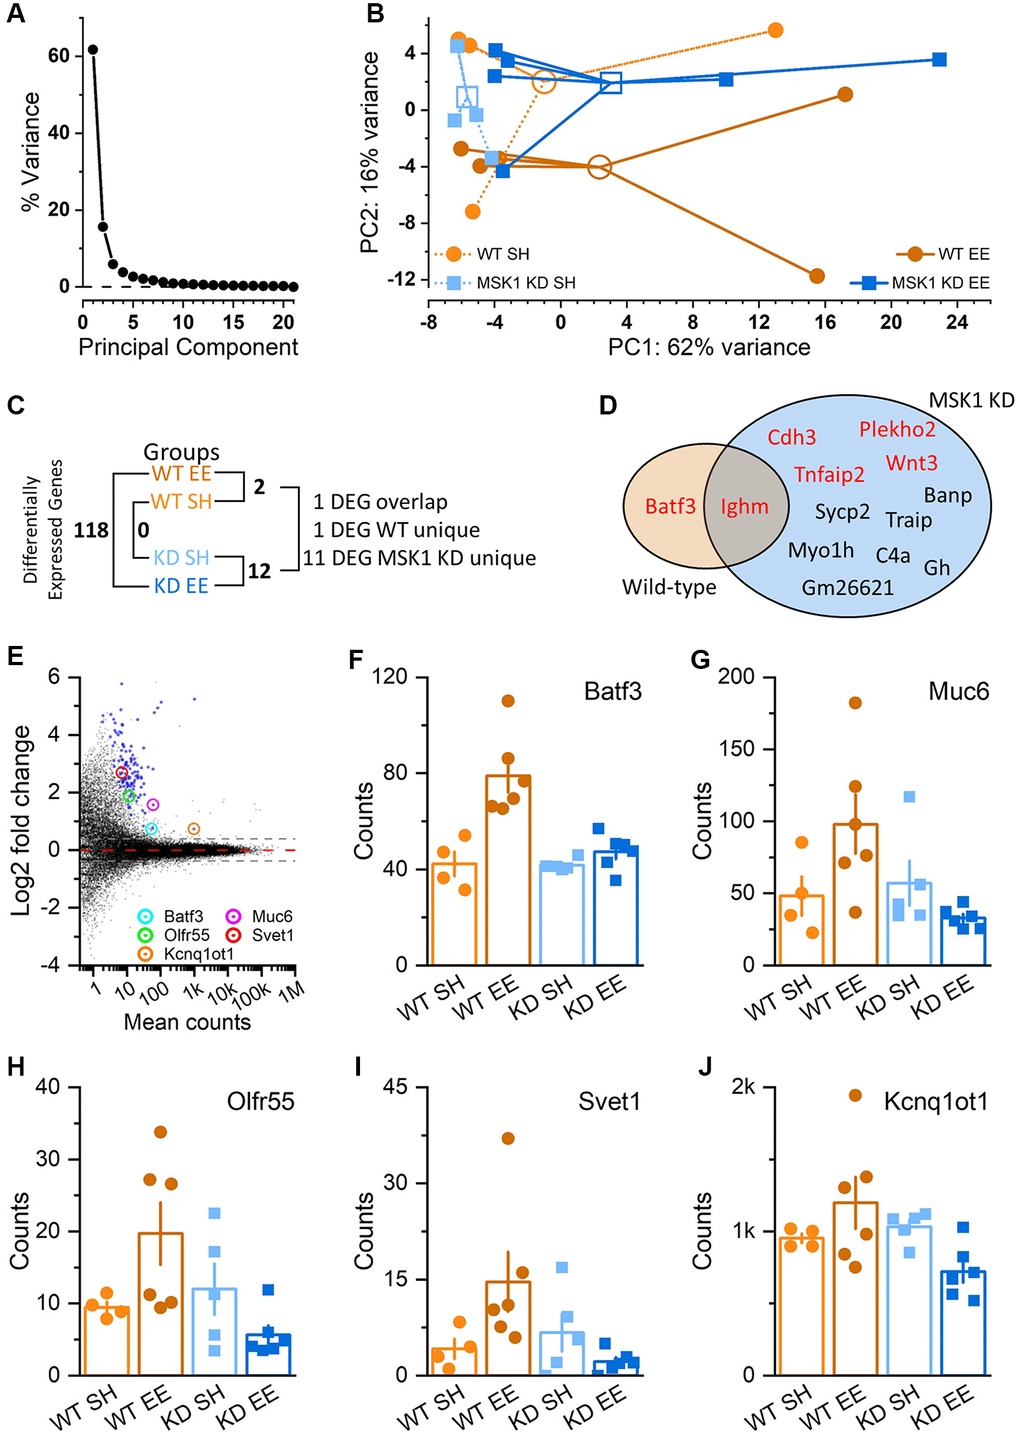
Figure 11.Regulation of hippocampal gene expression by experience and MSK1. (A) Scree plot of Principal Component (PC) variation as a percentage for the top 500 variance gene transcripts. One PC accounts for the majority of the variance (PC1; 62%), while the second PC (PC2) accounts for 12% of the variance. (B) PC analysis across groups and individual animals (filled symbols; 4–6 mice per group). Groups are identified by colour and are clustered around the arithmetic mean centroid (open symbol). The enriched WT group (WT EE) can be distinguished by migration along PC2. (C) Differential gene expression across groups, with the number of differentially-expressed genes (DEGs) given (Supplementary Data 1–7). (D) Venn diagram of unique and overlapping genes between WT and MSK1 KD mice. In red are genes that were upregulated by enrichment; in black text are those downregulated by enrichment in MSK1 KD mice (Supplementary Data 2 and 5). (E) MA plot of gene expression in enriched WT mice compared to that in enriched MSK1 KD mice. On the y-axis are plotted DESeq2 β-prior transformed log2 fold changes, with mean number of counts per group plotted along the x axis. Broken lines at ± 0.38 equate to a ± 1.3-fold change, with zero change indicated by the red broken line. Blue symbols show the 118 DEGs, while circled are five named genes with assigned functions (Supplementary Data 7). (F–J) Bar charts for each of the five genes showing individual counts for each animal in each group.
Figure 11 — MSK1 is required for the beneficial synaptic and cognitive effects of enriched experience across the lifespan | Aging