Submit an Article
Navigate
Home
Editorial Board
Editorial Policies
Current Volume
Archive
Scientific Integrity
Publication Ethics Statements
Interviews with Outstanding Authors
Newsroom
Sponsored Conferences
Podcast
Contact
Special Collections
Submit an Article
Online ISSN: 1945-4589
Research Paper
|
Volume 15, Issue 12
|
pp. 5873–5886
Identification of prognosis value and immune microenvironment features of ceRNAs in NSCLC with distinct gene mutation
Back to article
Figure 4
(4 of 9)
−
100%
+
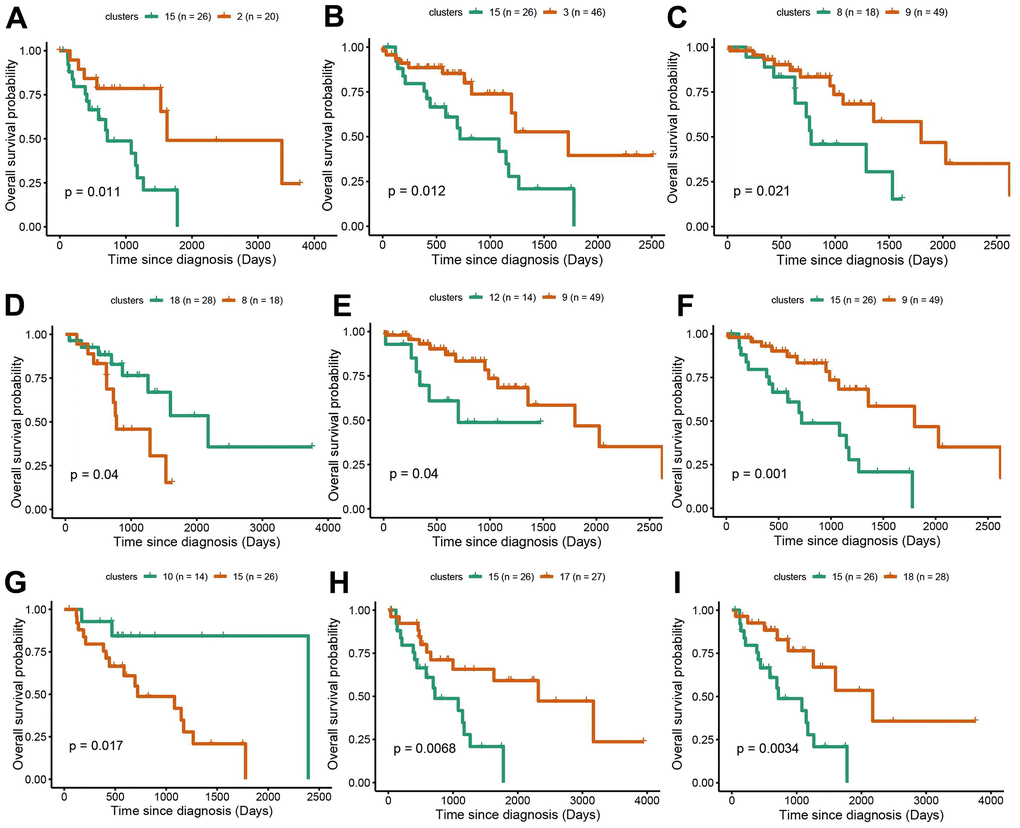
Figure 4.
Survival analysis between subgroups of LUAD.
(
A
–
I
) The survival probabilities between different clusters in LUAD. The statistical analysis was calculated based on log-rank test.