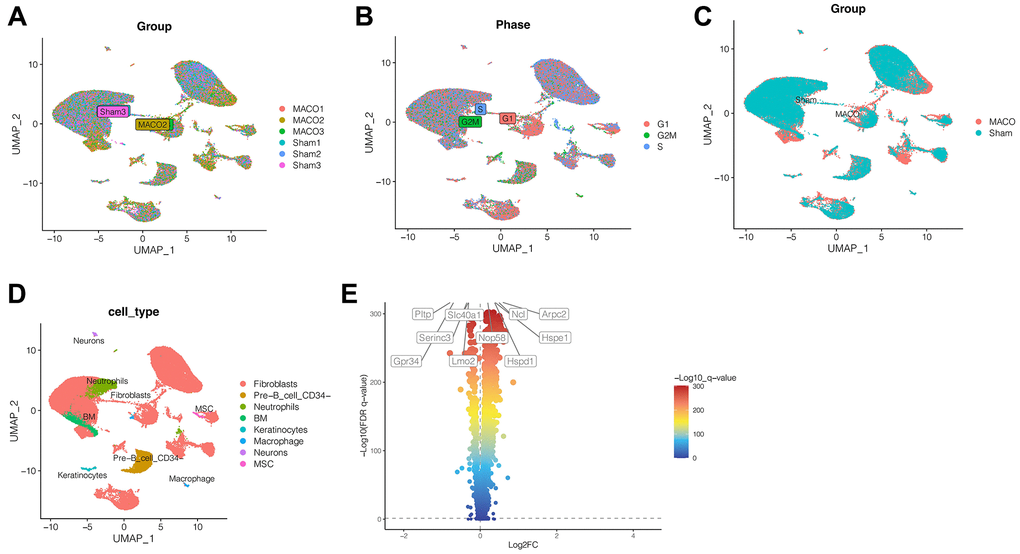
Figure 1.Single cell sequencing analysis. (A) No significant batch effect was observed. (B) The cell cycle had no effect on our subsequent analysis. (C) The heterogeneity between ischemic stroke group and normal control group. (D) 34 clusters were annotated as different cell types. (E) The first 5 genes that were significantly up-regulated were NCL, ARPC2, NOP58, HSPE1 and HSPD1, while the first 5 genes that were significantly down-regulated were PLTP, SLC40A1, SERINC3, LMO2 and GPR34. (Abbreviations: MACO: middle cerebral artery occlusion group; Sham: sham operation group).