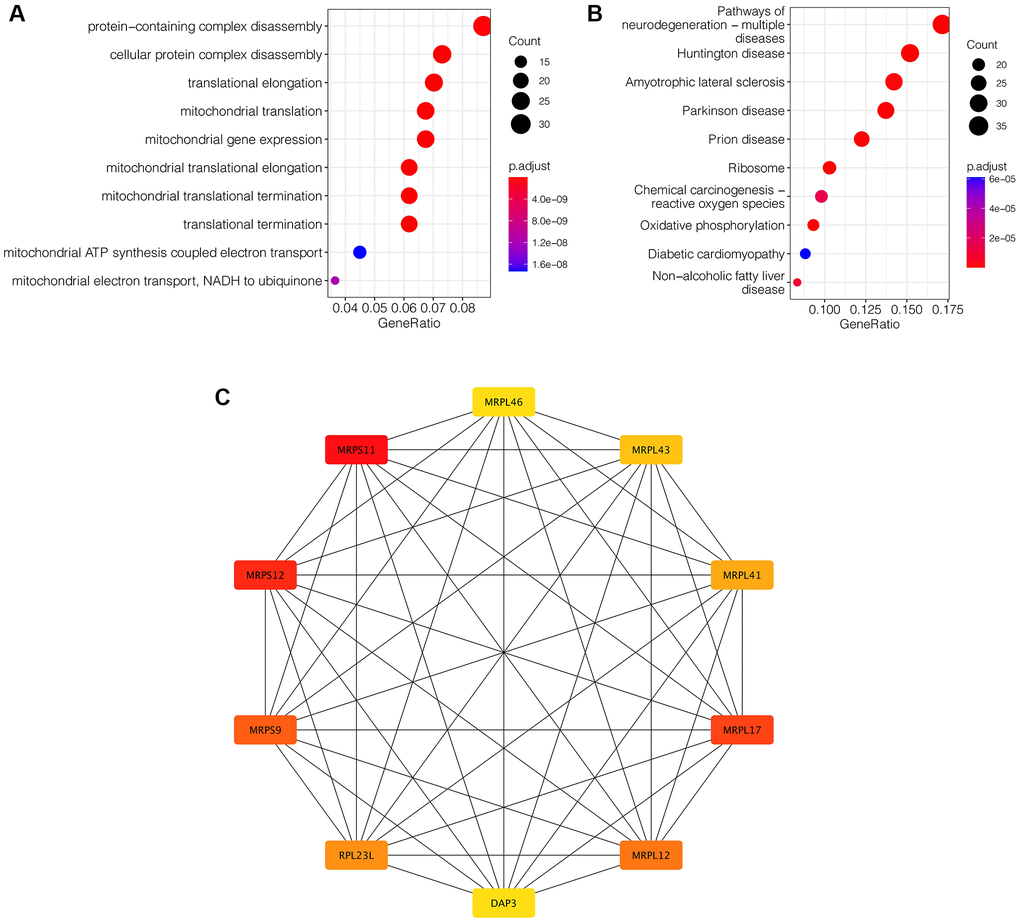
Figure 3.Enrichment analysis and protein-protein interaction network construction. (A) GO enrichment analysis. (B) KEGG enrichment analysis. (C) PPI network analysis. MRPS11 and MRPS12 are the two hub genes.
Figure 3 — Identification of key biomarkers in ischemic stroke: single-cell sequencing and weighted co-expression network analysis | Aging