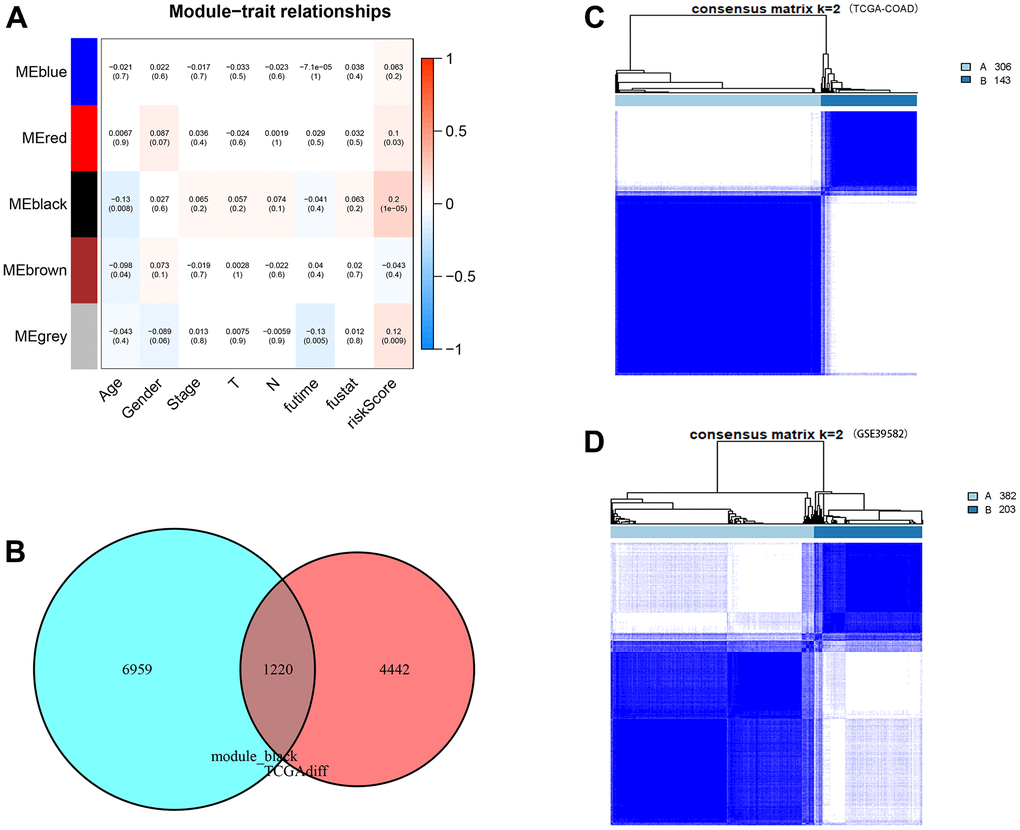
Figure 11.WGCNA analysis, consensus clustering and immune subtype construction. (A) Module–Clinical Trait Relationships of consensus module eigengene and different clinical features of COAD. Each row in the table corresponds to a module eigengene (ME), and each column to a clinical parameter (five module: blue, red, black and grey; eight clinical features: Age, Gender, Stage, T, N, futime, fustat and CDM riskScore). Each cell contained the correlation coefficients and p value (red, positively correlated; green, negative correlated). (B) Venn plot of CDM-associated co-expressed genes (5,662 genes) and upregulated genes (8,179 genes). Red represents coexpressed genes and cyan represents TCGA-COAD upregulated genes. (C) The consensus score matrix of TCGA-COAD samples when k = 2. Subtype A contains 306 samples and subtype B contains 143 samples. (D) The consensus score matrix of GSE39582 samples when k = 2. Subtype A contains 382 samples and subtype B contains 203 samples.