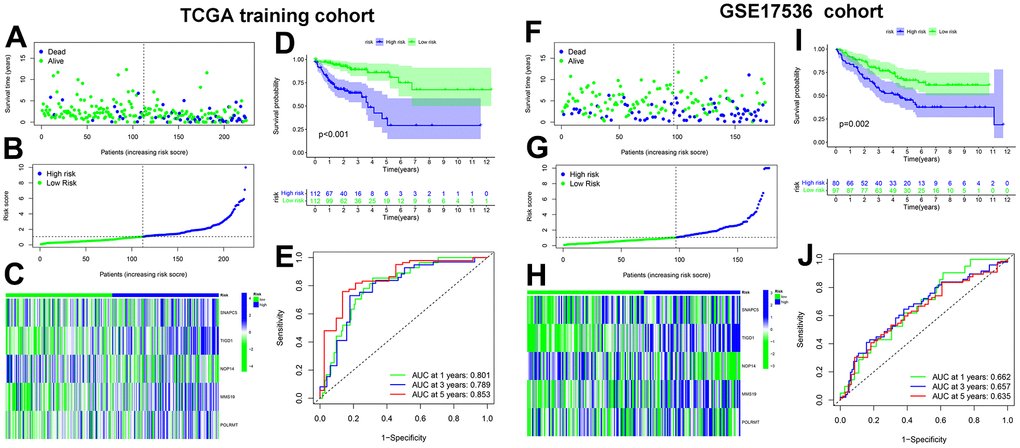
Figure 2.Cancer Dependency Maps (CDMs) signature construction and validation in TCGA training cohort and GSE17536 cohort. (A) Survival scatter plot in TCGA training cohort. A dot represents a CC patient (blue represents Dead, Green represents alive). Dotted lines show the median of risk score that dichotomize patients into high and low groups. (B) Risk score plot in TCGA training cohort. The patients of CC are ordered by the risk score of the CDM signature. Dotted lines show the median of risk score that dichotomize patients into high (blue) and low (green) groups. (C) Heatmap of five CDM signature genes (SNAPC5, TIGD1, NOP14, MMS19 and POLRMT) in TCGA training cohort. Blue represents high-CDM risk group and green represents low-CDM risk group. (D) Kaplan-Meier plot in TCGA training cohort (p<0.001). Survival curves for high (blue) and low (green) risk-CDM groups dichotomized at the median of risk-CDM score are plotted. 95% confidence intervals for each group are also indicated by shadow area. (E) The ROC curve of CDM signature in TCGA training cohort. Green show one year AUC value (AUC value=0.801), blue show three years AUC value (AUC value=0.789) and red show five years AUC value (AUC value=0.853). (F) Survival scatter plot in GSE17536 cohort. (G) Risk score plot in GSE17536 cohort. (H) Heatmap of five CDM signature genes (SNAPC5, TIGD1, NOP14, MMS19 and POLRMT) in GSE17536 cohort. (I) Kaplan-Meier plot in GSE17536 cohort (p=0.002). (J) The ROC curve of CDM signature in GSE17536 cohort. One year AUC value (AUC value=0.662), three years AUC value (AUC value=0.657) and five years AUC value (AUC value=0.635).