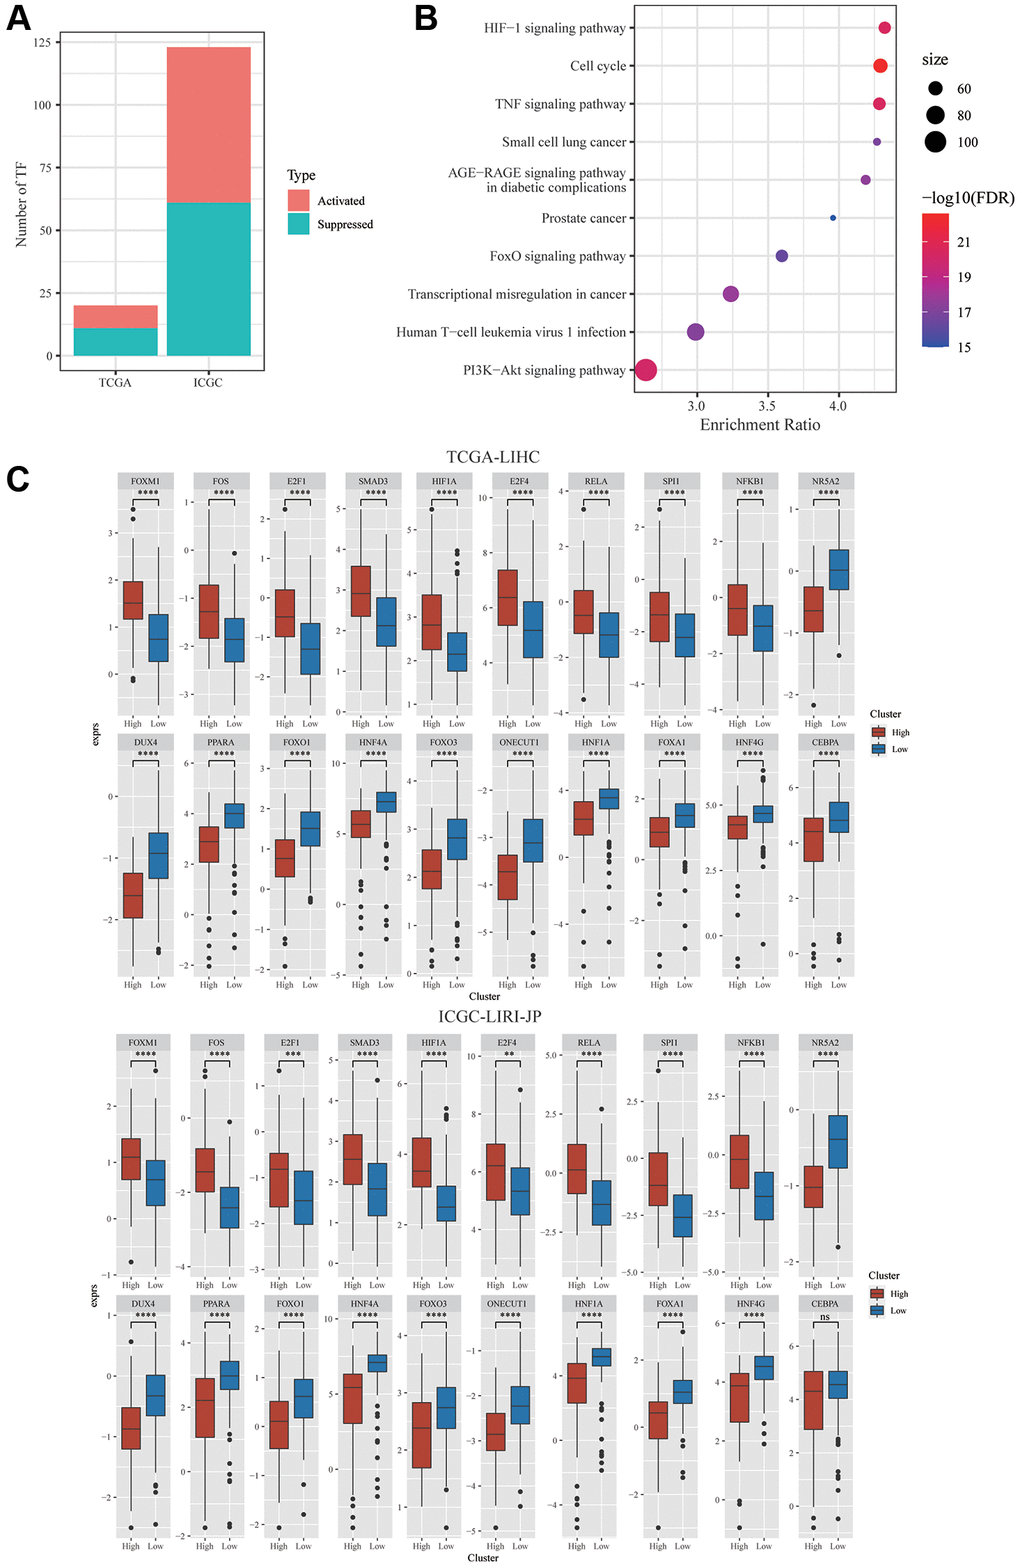
Figure 4.Integrative Analysis of mTORC1-related genes. (A) Distribution of the activated and suppressed TFs in C2 in comparison with C1 in TCGA-LIHC and ICGC-LIRI-JP cohort. (B) The findings of the functional enrichment analysis of TFs upregulated in the C1 subtype in TCGA-LIHC cohort. (C) The dysregulation in TF activity of the upregulated transcription factors in the TCGA-LIHC and ICGC-LIRI-JP cohort.