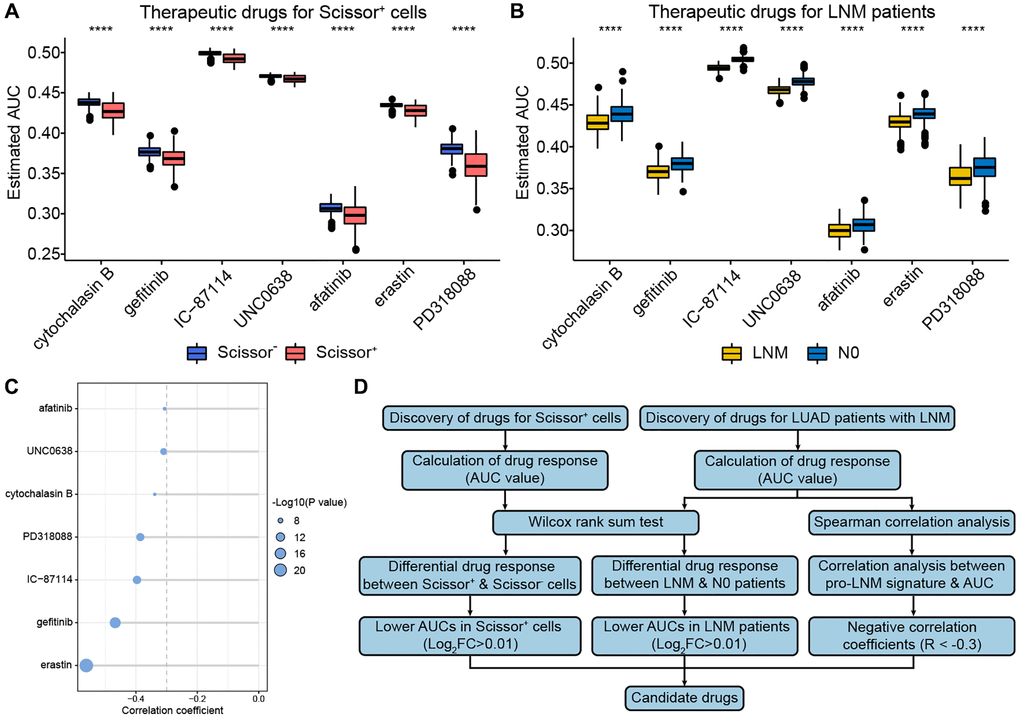
Figure 6.Identification of potential drug targets for patients with LNM. (A, B) The boxplots of differential drug response analysis in Scissor+ cells and LNM patients. (C) The Spearman’s correlation analysis between pro-LNM signature and AUC. (D) The overall workflow for identifying potential drug targets for patients with LNM. ****, means p < 0.001. Abbreviations: LNM: lymph node metastasis; AUC: area under the curve.