Submit an Article
Navigate
Home
Editorial Board
Editorial Policies
Current Volume
Archive
Scientific Integrity
Publication Ethics Statements
Interviews with Outstanding Authors
Newsroom
Sponsored Conferences
Podcast
Contact
Special Collections
Submit an Article
Online ISSN: 1945-4589
Research Paper
|
Volume 15, Issue 14
|
pp. 7038–7055
Exploring molecular markers and drug candidates for colorectal cancer through comprehensive bioinformatics analysis
Back to article
Figure 6
(6 of 10)
−
100%
+
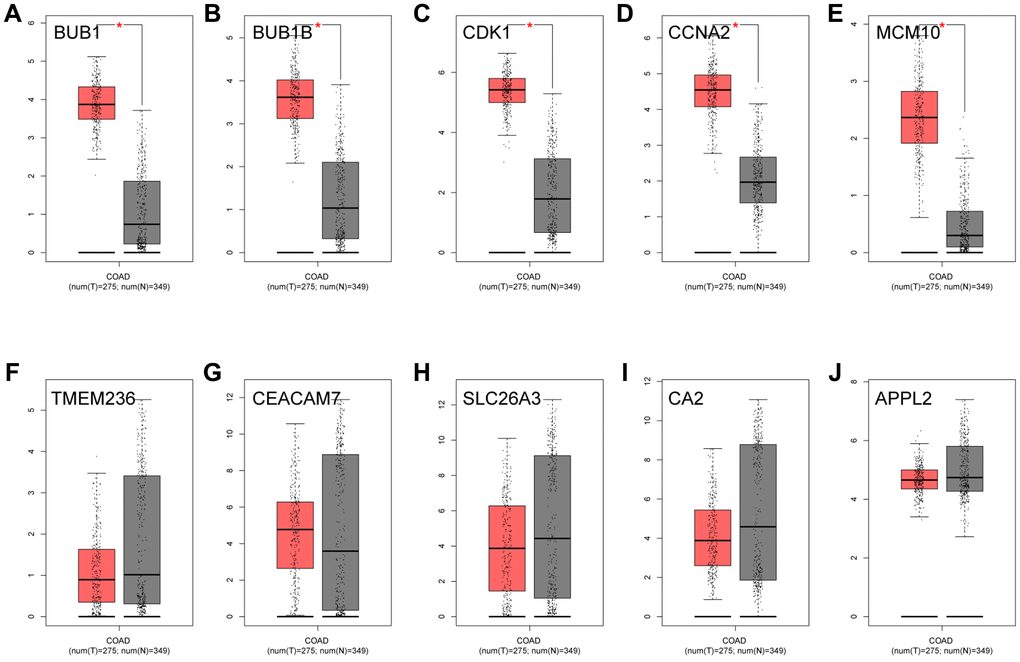
Figure 6.
The expression analysis of 10 key genes in CRC (based on TCGA data in GEPIA).
(
A
) BUB1, (
B
) BUB1B, (
C
) CDK1, (
D
) CCNA2, (
E
) MCM10, (
F
) TMEM236, (
G
) CEACAM7, (
H
) SLC26A3, (
I
) CA2, (
J
) APPL2.
Figure 6 — Exploring molecular markers and drug candidates for colorectal cancer through comprehensive bioinformatics analysis | Aging