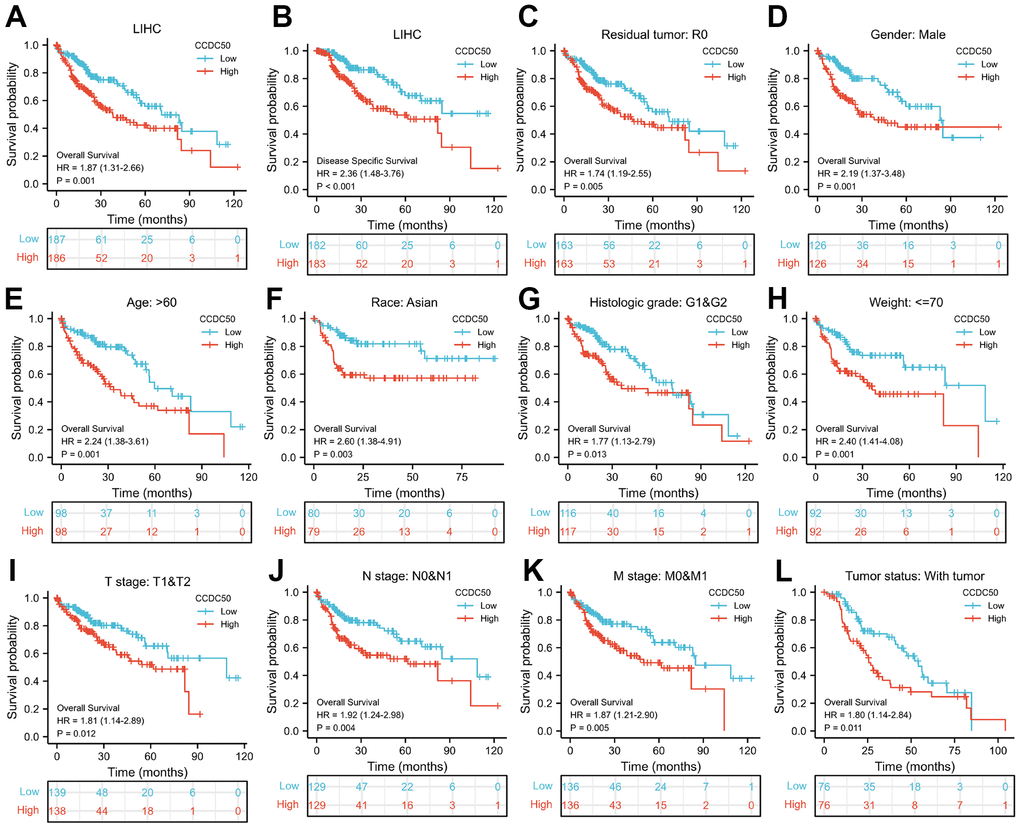
Figure 3.Prognostic analysis of CCDC50 in HCC. (A, B) The correlation between CCDC50 and OS, and DSS. (C–L) The correlation between CCDC50 and OS in different clinical subgroups of HCC, including residual tumour, gender, age, race, histologic grade, weight, TNM stage, AND tumour status.