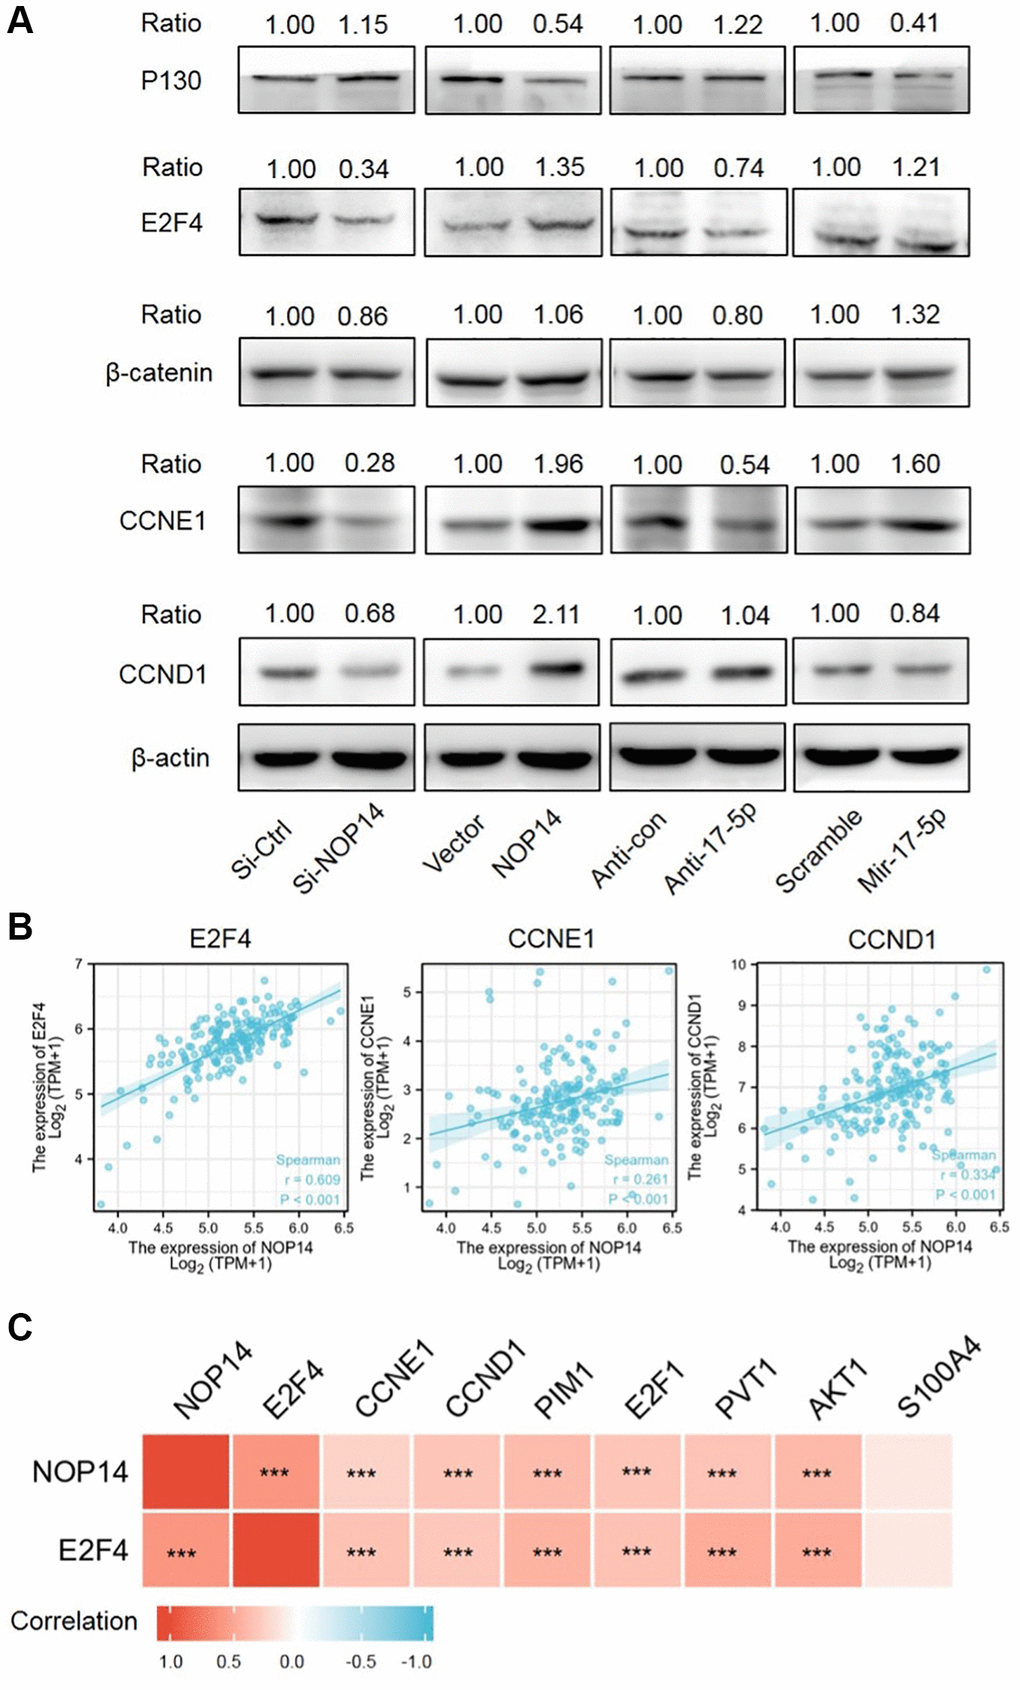
Figure 4.Screening and verification of downstream targeted genes of the NOP14-miR17-5p pathway. (A) Expression level of downstream targeted genes after up- or downregulation of NOP14 or miR17-5p, as determined by Western blot with standardized relative gray ratio. (B) Scatter plots showing significant positive correlation of E2F4, CCNE1, CCND1 with NOP14 in pancreatic cancer tissue from TCGA RNA seq data. (C) Heatmap diagram showing correlation of above targeted genes with NOP14 in pancreatic cancer tissue from TCGA RNA seq data. ***P < 0.001.