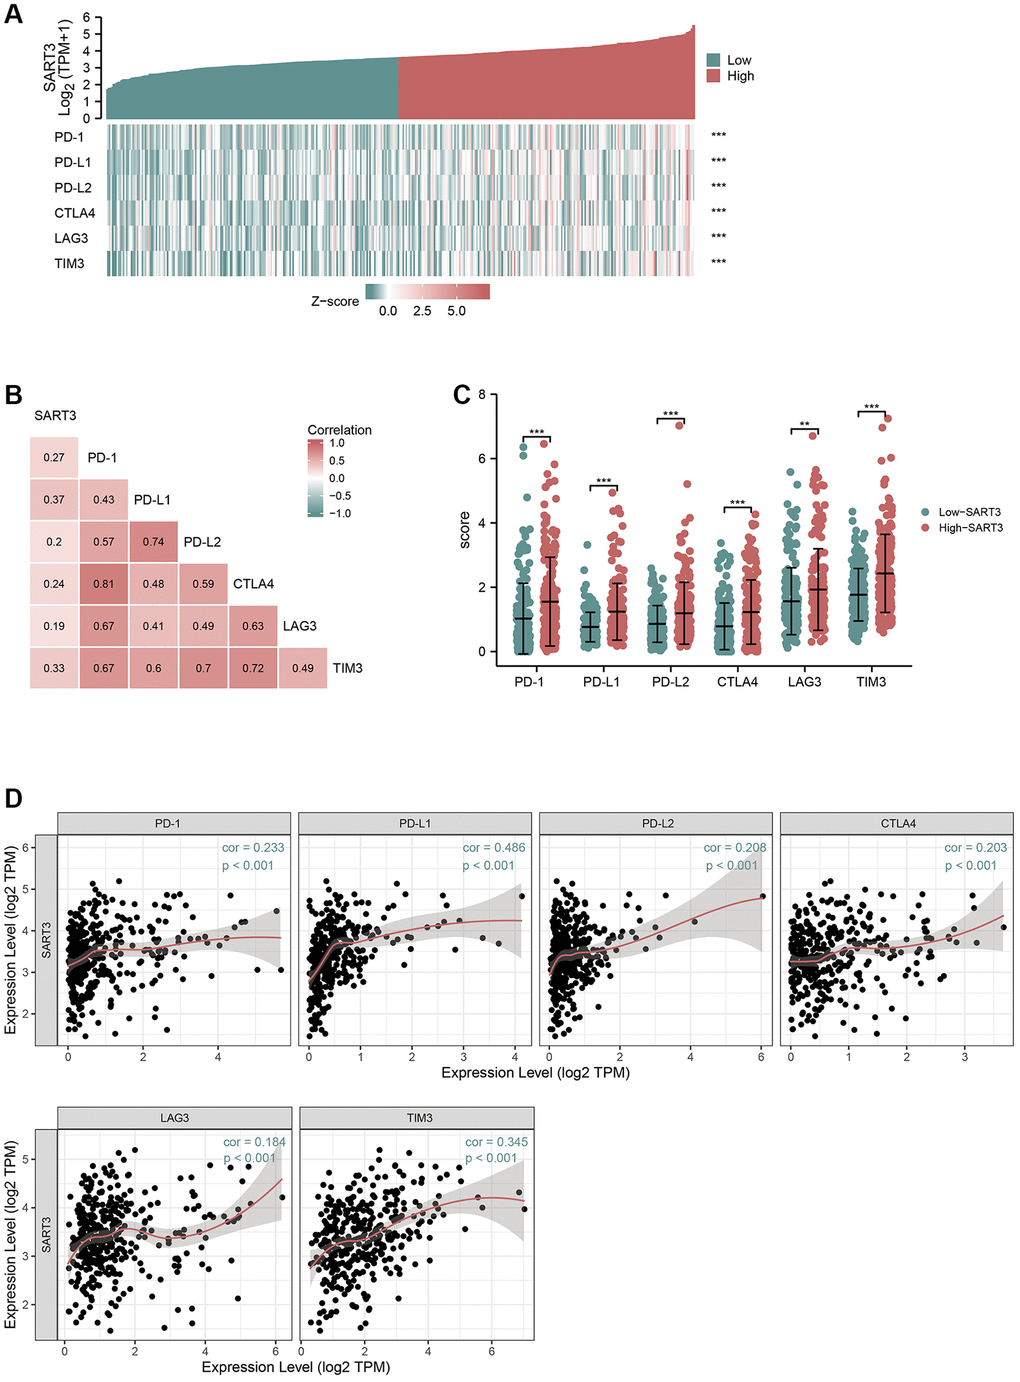
Figure 6.High expression of SART3 upregulates the expression level of immune checkpoint genes. (A) Heat map showing co-expression of SART3 and immune checkpoint genes. (B) Correlation matrix showing SART3-immune checkpoint association. (C) Expression levels of immune checkpoint genes between SART3 high and SART3 low groups. (D) Correlation of SART3 with immune checkpoint genes was verified in TIMER database.