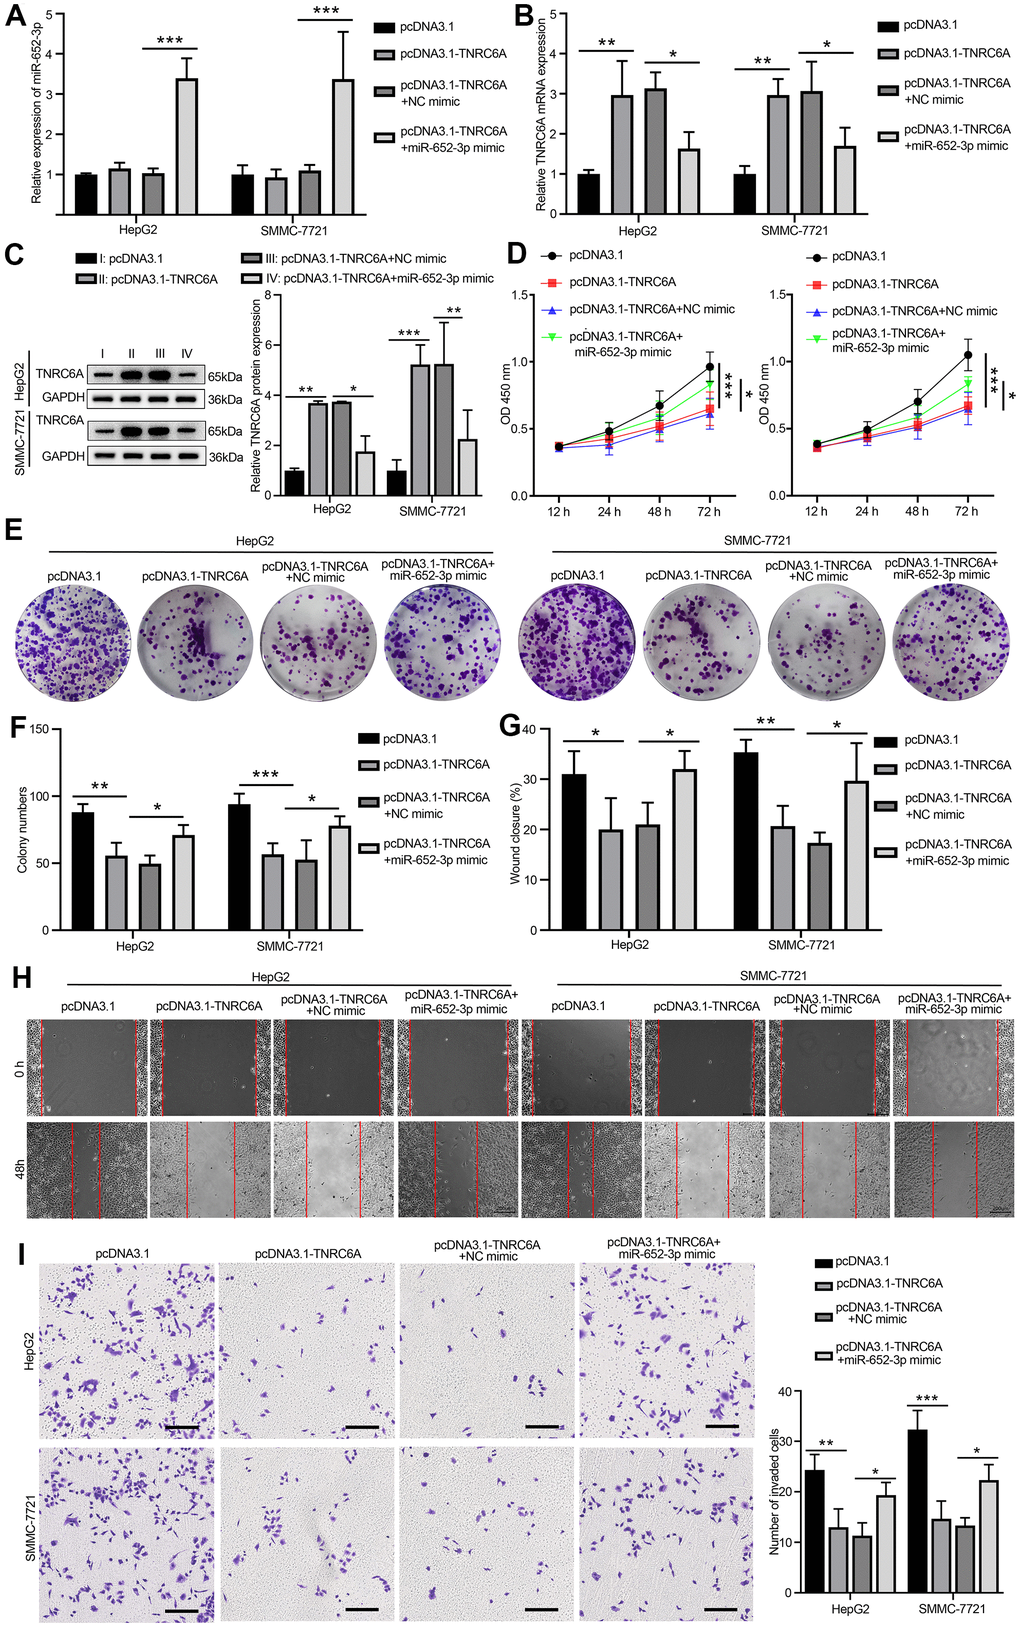
Figure 5.Overexpression of miR-652-3p aborted the inhibitive effects of TNRC6A on the proliferation and metastasis of HCC cells. (A) The expression of miR-652-3p inHepG2 and SMMC-7721 cells determined by qRT-PCR, Cells were treated with four different means: pcDNA3.1 group, pcDNA3.1-TNRC6A group, co-transfection pcDNA3.1-TNRC6A and NC mimics and co-transfection pcDNA3.1-TNRC6A and miR-652-3p mimic group. Data were presented as the mean ± SD, and analyzed with Student’s t-test *** P < 0.001 (B) The mRNA expression of TNRC6A in HepG2 and SMMC-7721 cells determined by qRT-PCR. Data were presented as the mean ± SD, and analyzed with Student’s t-test *P < 0.05; ** P < 0.01. (C) The protein expression of TNRC6A in HepG2 and SMMC-7721 cells determined by WB. Histogram show the protein expression of TNRC6A in HepG2 and SMMC-7721 cells. Data were presented as the mean ± SD, and analyzed with Student’s t-test *P < 0.05; **P < 0.01, ***P < 0.001. (D) Proliferation of HepG2 and SMMC-7721 cells determined by CCK-8 after treating with different ways, Data were presented as the mean ± SD, and analyzed with Student’s t-test. *P < 0.05 *** P < 0.001. (E) Colony formation assay of HepG2 and SMMC-7721 cells after treating with different ways (F) Histogram show the amount of colony in HepG2 and SMMC-7721 cells. Data were presented as the mean ± SD, and analyzed with Student’s t-test *P < 0.05; ** P < 0.01 *** P < 0.001. (G) Histogram show the distance of cellular migratory in HepG2 and SMMC-7721 cells. Data were presented as the mean ± SD, and analyzed with Student’s t-test *P < 0.05; ** P < 0.01. (H) Migration of HepG2 and SMMC-7721 cells determined by wound healing. (I) Invasion of HepG2 and SMMC-7721 cells determined by transwell. Cells that invaded to the bottom surface were stained with crystal violet and observed by light microscopy (magnification, 100×). Histogram show the capability of cellular invasion in HepG2 and SMMC-7721 cells. Data were presented as the mean ± SD, and analyzed with Student’s t-test *P < 0.05; ** P < 0.01 *** P < 0.001.