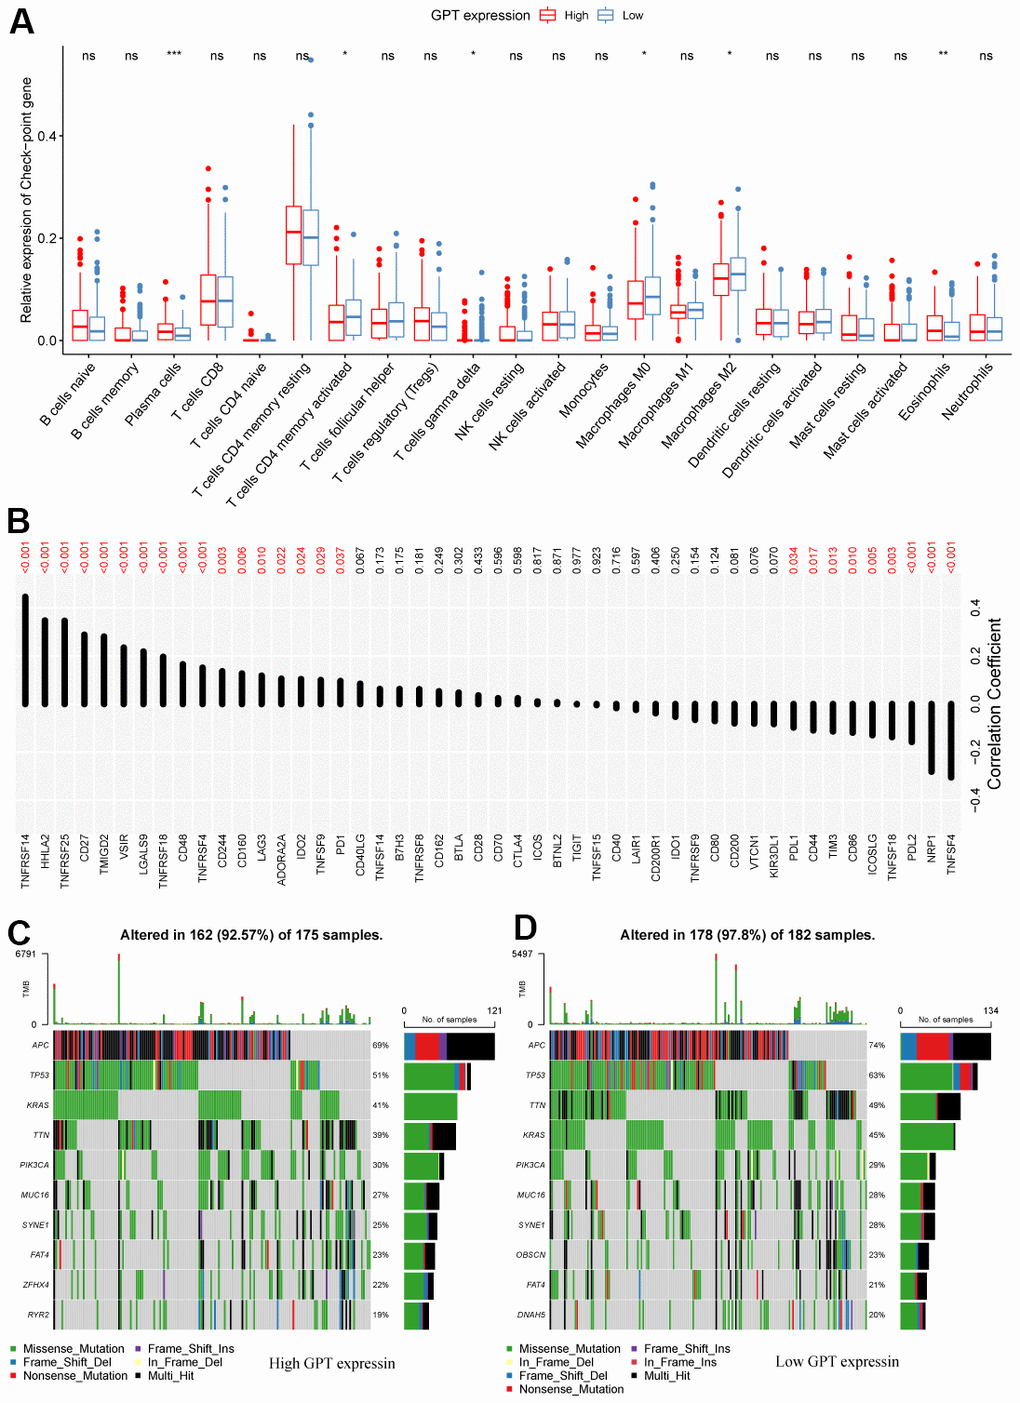
Figure 7.Correlation between GPT expression and the tumor microenvironment. (A) Differential analysis of immune cell infiltration levels with different levels of GPT expression. (B) Correlation between GPT expression and immune checkpoint molecules. (C, D) Somatic mutation profiles at different GPT expression levels.