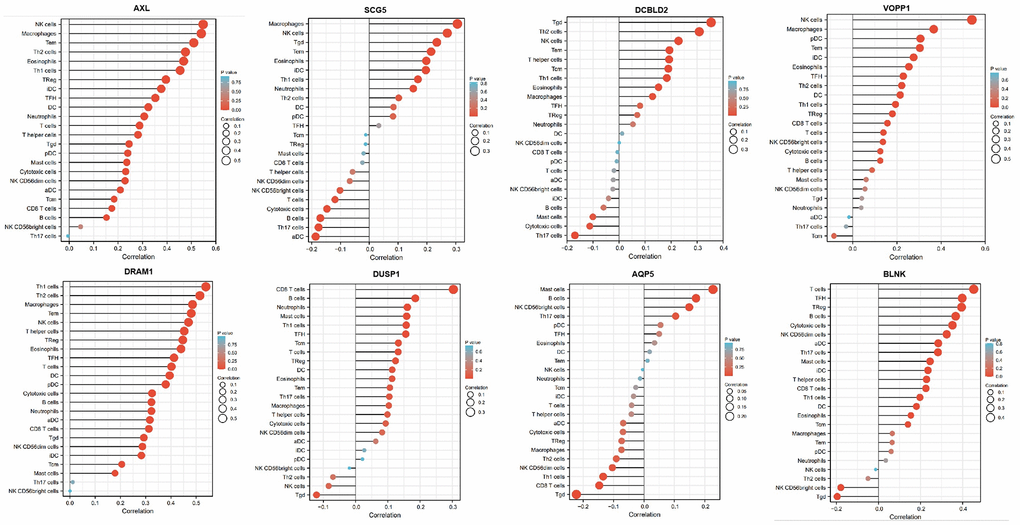
Figure 13.Relationship between 8 mRNAs and immune infiltration. The lollipop plot shows the correlation between AXL, SCG5, VOPP1, DCBLD2, DRAM1, DUSP1, AQP5 and BLNK expression and 24 immune cell subsets infiltration. The size of dots indicates the absolute Spearman r value.