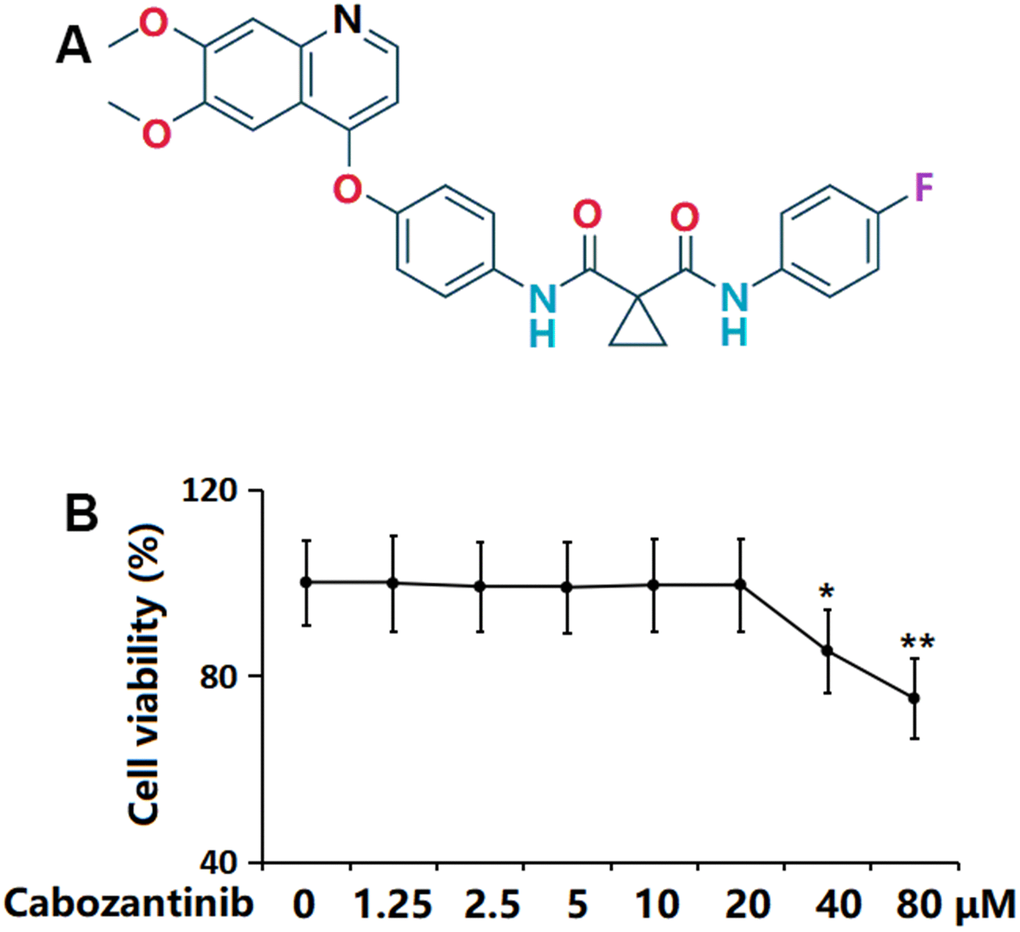
Figure 1.Cytotoxicity of Cabozantinib in SW1353 chondrocytes. (A) Molecular structure of Cabozantinib; (B) Cells were stimulated with Cabozantinib at the concentrations of 0, 1.25, 2.5, 5, 10, 20, 40, 80 μM for 24 hours. The cell viability was measured using the MTT assay (n=6, *, ** P<0.05, 0.01 vs. Control group).