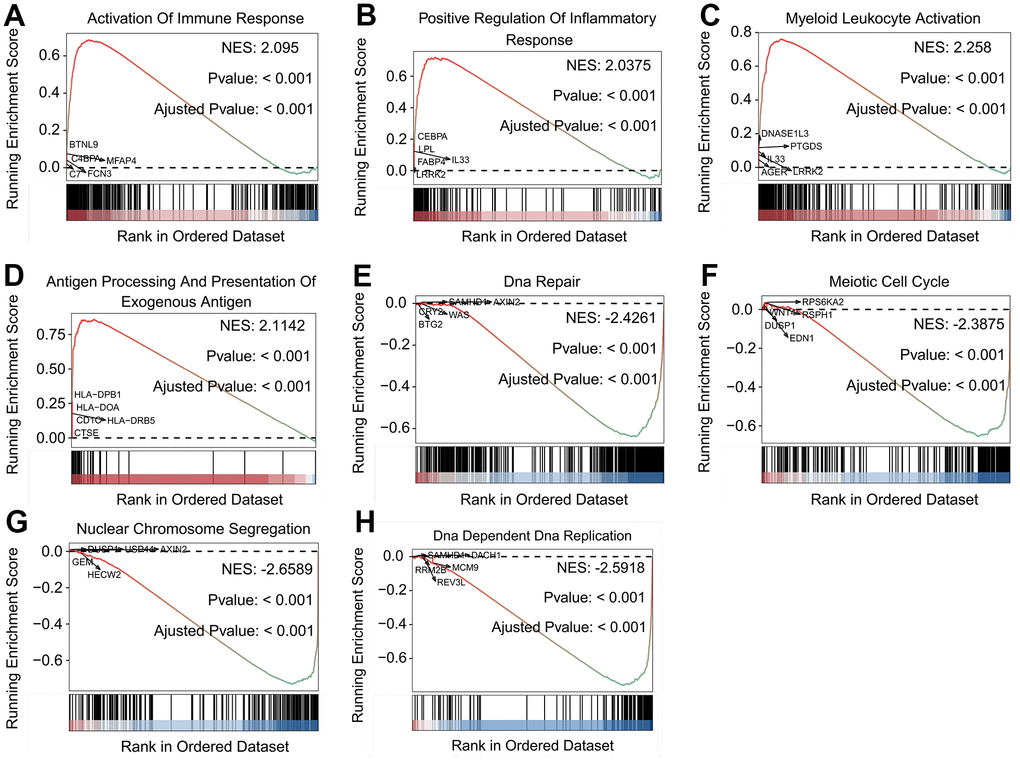
Figure 3.Biological features of LUAD patients in the stratified SFTPC subgroups. (A–H) Examples of GSEA results of LUAD patients with high (A–D) and low (E–H) expression of SFTPC.
Figure 3 — Abnormal low expression of SFTPC promotes the proliferation of lung adenocarcinoma by enhancing PI3K/AKT/mTOR signaling transduction | Aging